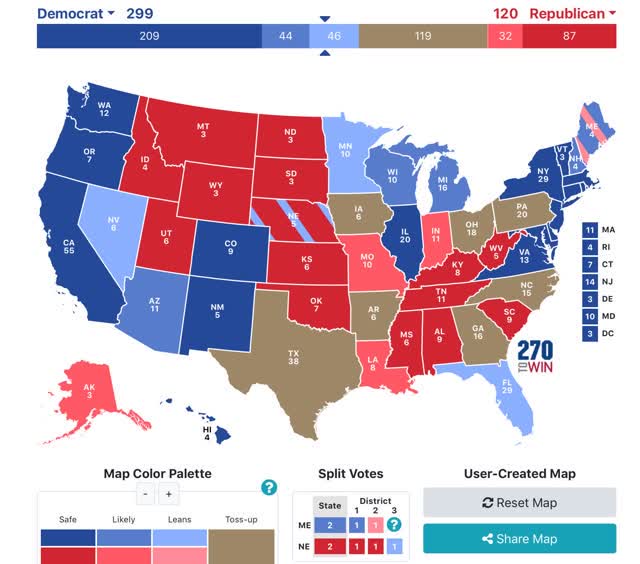
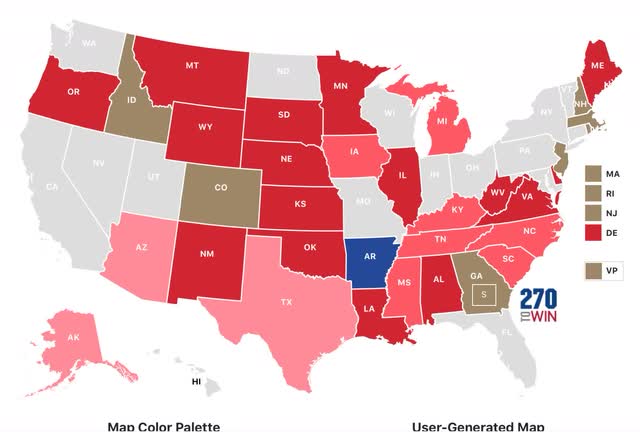
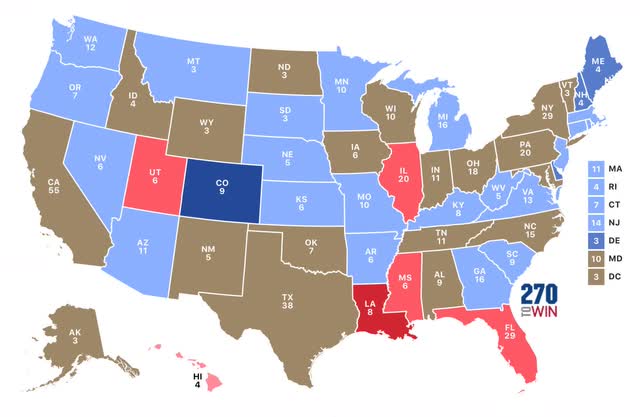
Way back in June I started writing nowcasts for the 2020 elections. Here’s what my very first map looked like:
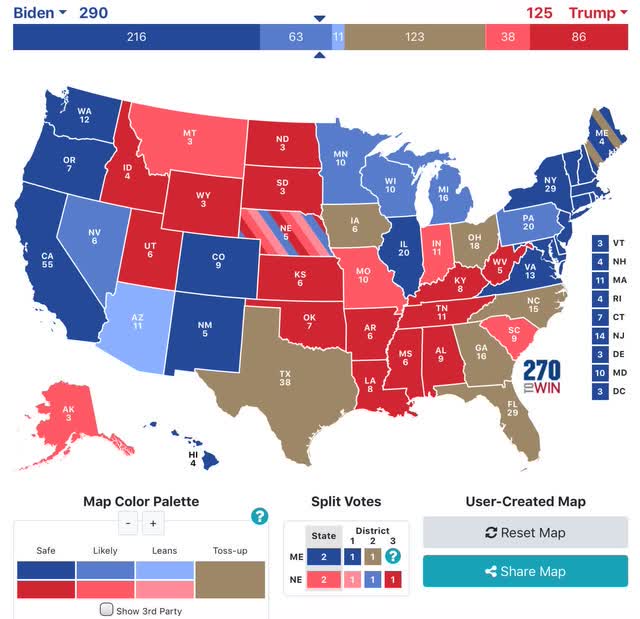
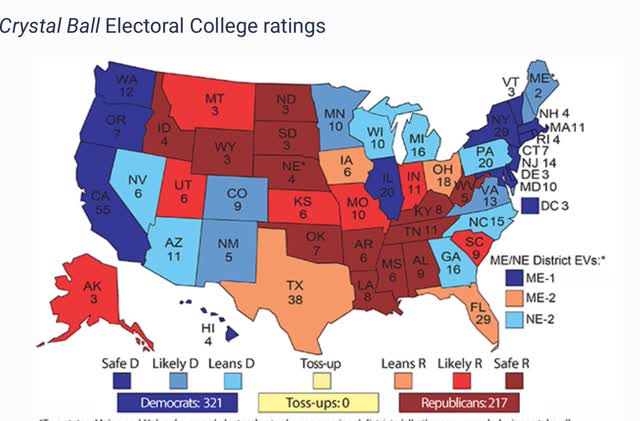
And here’s what the last one looked like:
When I pushed the “toss-ups”, by lowering the threshold from 3% to 1%, NC, GA, and FL also became “lean Biden” States.
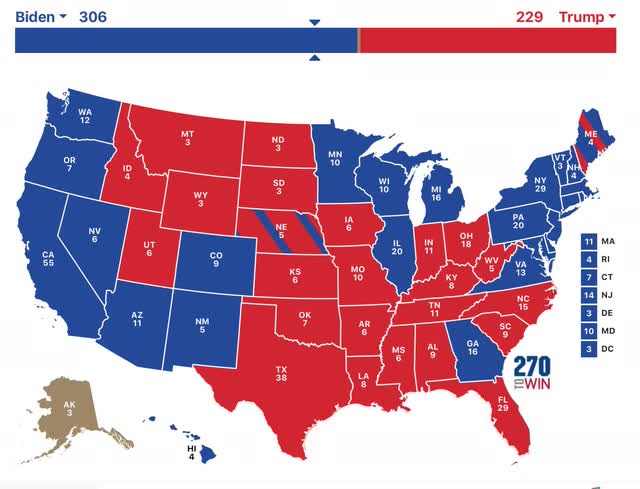
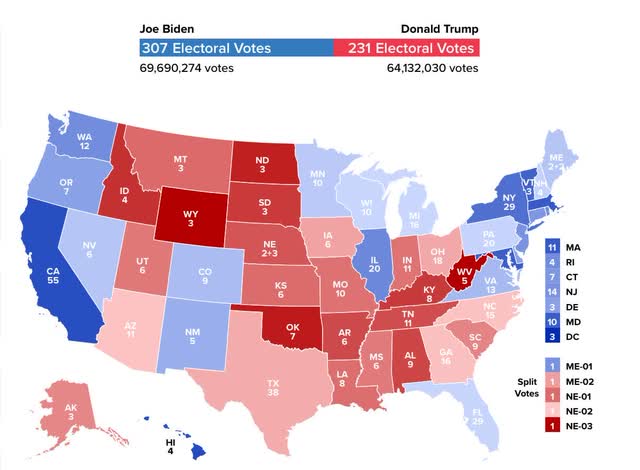
Here’s how the election actually turned out, based on results through today (note: Alaska has only counted 50% of its votes, so the outcome there is still unknown):
Two weeks ago, I wrote
“The “blue wall” is extremely likely to hold. And if it does, Trump’s chances of victory are foreclosed.”
That turned out to be right on point.
Further, last week, and almost every week beforehand, I included a sentence like this:
“Even so, Biden still has 279 “solid” or “likely” Electoral votes, enough to win without any “leaning” or toss-up States.”
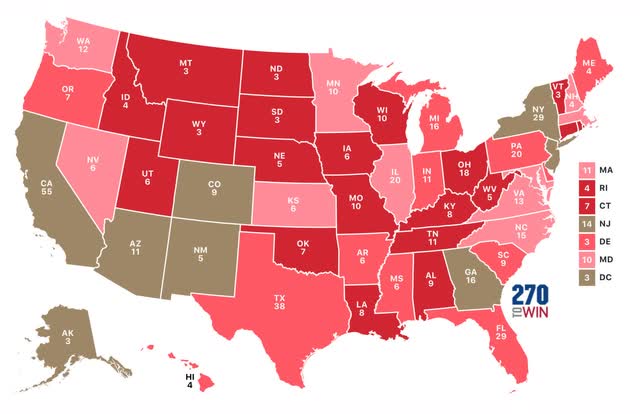
That turned out to be the most prudent caution, as on average the polls missed very badly this year. The below 2 maps contrast the actual results with Nate Silver’s polling average for each State, 1st for the Presidency and 2nd for the Senate races, using the following color code:
0 – 1.9% deviation – no color
2% – 3.9% deviation – light color
4% – 5.9% deviation – medium color
6% or more deviation – dark color
Here’s the deviations from Nate’s numbers for the Presidency:
And here they are for the Senate:
The median deviation in his percentages for Biden was -5.2%. In not even a single State was the deviation 2% or more in favor of Biden. The median deviation in his percentages for Democrats running for the Senate was even worse, at -6.6%.
By contrast, Larry Sabato’s final Presidential forecast only missed on North Carolina:
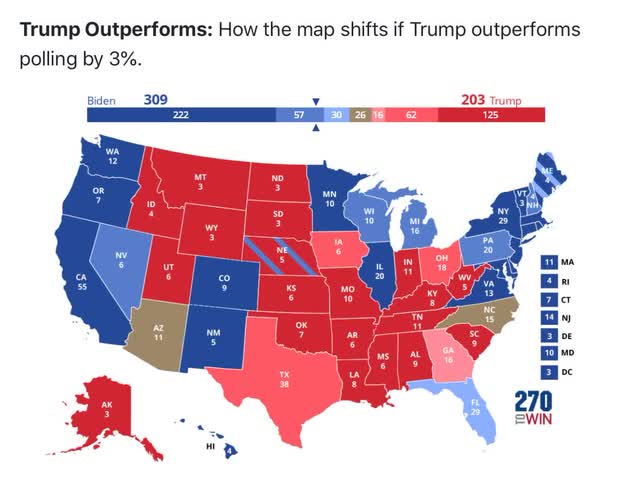
The median forecast in Sam Wang’s model at the Princeton Election Consortium was also too optimistic, but he correctly always included a map of what would happen if Trump outperformed the polls by 3%:
And yet another alternative approach that was much better was the Cook Political Report’s “Swingometer,” which was explained thusly:
“How it Works: Start with the results of the previous election, adjusted for demographic change since 2016. Then, adjust the sliders below to see how shifts in turn out and support among five demographic groups could swing the Electoral College.”
Using their turn-out assumptions, this is the map they generated:
The map only misses Arizona, Florida and Georgia. Further, note that it correctly shows the “blue wall” holding, but being very close. Using the same criteria as I used for Nate Silver’s projections, here’s how close the “Swingometer” came in each State:
The median deviation from the actual 2020 results known so far is only 2.0% in favor of Biden. In other words, simply projecting the same demographics 4 years forward, and estimating increased (or decreased) turnout based on the past turnout for each age, on average only 2% of voters either changed their mind in favor of Biden, or groups favorable to Biden turned out an average of 2% more of the total.
Finally, to see how closely Trump’s results matched results in the Senate races, I applied the same metrics to the actual Presidential and Senate results. Blue (Red) means a result more favorable to, or less unfavorable to (less favorable to, or more unfavorable to), Biden than the Democratic Senate candidate:
The median deviation between the Senate and Presidential results was only +0.3% overall. When we ignore the direction of the deviation, it is about 3.5%.
To summarize: there are some very serious shortcomings in Nate Silver’s model. Both he and the Economist (G. Elliott Morris) would be well advised to pick up Sam Wang’s approach and create maps for significant poll deviations. Further, the “Swingometer” looks like a very promising tool.
In terms of the 2020 election, it looks like very few voters actually changed their minds in the past 4 years in their opinion of Trump. It appears that new voters or increased turnout among some demographics were the biggest factors in the different outcome this year. And a significant percentage of “never Trump” GOP voters split their ticket, voting the GOP Senate candidate down-ballot.
I got a little bored. Bottom line the nation is still alive and it is still uncertain whether Moscow Mitch will be able to kill it. The polls were dramatically off and basically no one should even look at them. I am still celebrating because while 70 million people voting for Trump is horrifyingly, at least he lost and America and most of the world partied. We still have a pandemic. We still have economic collapse. We still have climate change. We still have systemic racism. But we have a chance and at least for the moment we have turned back fascism. I will take small victories. 😊
NDD
In Michigan around Ann Arbor, I am the numbers guy. Lots of noise about Dems counting votes which should not have been counted. Graham even talked about one of the places without identifying its location. It was pretty obvious which place it was as you could smell it from the noise on facebook of having discovered the horror of it. Republican politicians are not saying much about this one or another one I discovered in the suburbs of Detroit where the money is.
The big blowup in Michigan was about one county which suddenly voted “Blue.” Not that this is a reality today’; the state is turning more Blue as time goes by. You have !94 and 96 going west out of Detroit and more and more people are migrating out of Detroit along the corridor.
Antrim County is north of Traverse City. You just keep going up Route 31 on the east side (obviously) of Lake Michigan. I will bet the wind out of the west dumps some heavy snow in Winter and those winds sure can blow cold way out there. Population maybe 25,000. Summers got to be nice with plenty of fishing. Like all other Michigan counties administratively, they have a county clerk and the townships making up the county has township clerks who are responsible for the administration of the area they were elected to and the “vote.” It is a good gig which does not pay a lot of money.
As it turns out, Antrim voted Dem when it should have voted Repub. That area is staunchly Repub. It appears though this was by accident as the scanners did not line up the output properly. It is almost funny except, everyone got excited and then there is this conspiracy trump is escalating. Then there is the Grahams and Cruz’s fueling the fire even more. The bottom line here is the County Clerk did not have the software updated in some of the voting machines. Lot of noise on Facebook about how the vote was flawed. Not a chirp after I explained how it came to be and cited a news story.
It is all political garbage.
Another issue popped up near Rochester, MI where one Repub clerk sent in his data, a Repub candidate lost his election, and upon review by a Dem; it was found the the Repub Clerk had made an error. Upon correction, the Repub candidate won the election by ~1100 votes. Human error people and no conspiracy. I did not read where there were any thank-yous’ made.
Meanwhile Graham and Cruz are feeding the fire with lies. Michigan went Dem by over 140,000 votes for the Pres. Senator Peters won by 85,000 votes also and James is holding out. I do not know of any election which was overturned when the lead was that great.
~725,000 people turned out to vote in Michigan. ~500,000 more for Dems, the balance to Repubs, and the vote for Libertarians, Communists, and others dropped back to ~1.7% in 2020 as compared to ~5.7% in 2016. The anybody but trump or whoever vote did not come into play this year. I am not so sure we should believe polls so much.
Here is some fun play regarding polling and the final numbers. What if we are wrong and the pollsters had it correctly called? It means 10 million votes went missing or there is something fishy regarding the mystery rural voters.
Frankly I think we should turn it into a face book meme as a counter to the Republicans. You know, fighting fire with water.
As the author starts: Let me engage in a bit of rational, logical conspiracy theory.
https://hisvorpal.wordpress.com/2020/11/08/where-are-all-those-votes/
@Terry,
Amen.