Total US cases: 6,519,573
Average cases last 7 days: 34,744
Total US deaths: 194,071
Average deaths last 7 days: 733
Source: COVID Tracking Project
I continue to expect the pandemic to wax and wane in relative terms at least until next January 20, as the public reaction in various States varies between panic and complacency.
Let’s start by comparing the rates of cases and deaths in the US with the North American standard – Canada:
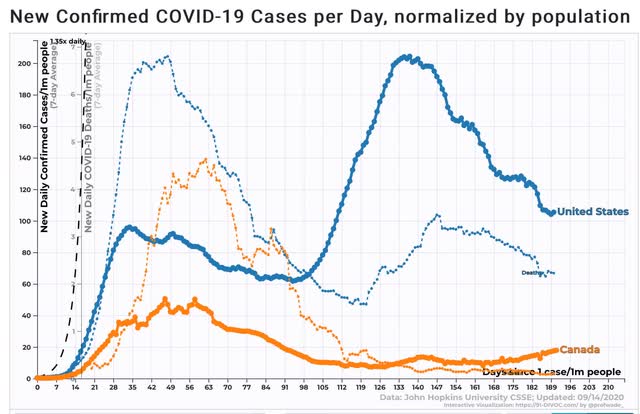
In contrast with the US, Canada averaged 18 cases per day per million people in the last 7 days (vs. 105 for the US), and 0.1 deaths (vs. 2.2 for the US). That is what we could have as well if there were competent Federal leadership.
The Top 10 States for infections have shifted to the Midwest:
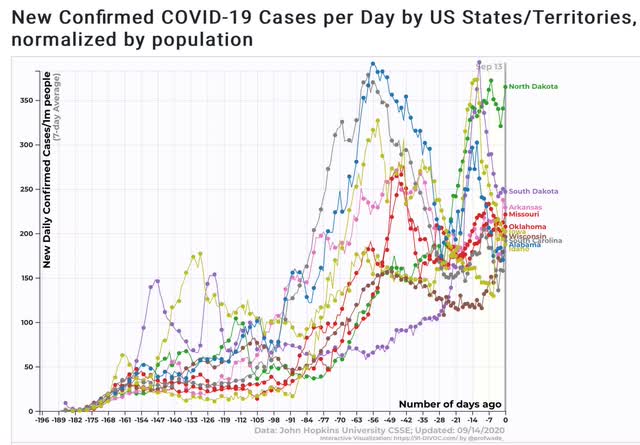
These are rates that are virtually out of control (the worst was about 500 cases per day for NY and Arizona at their peaks).
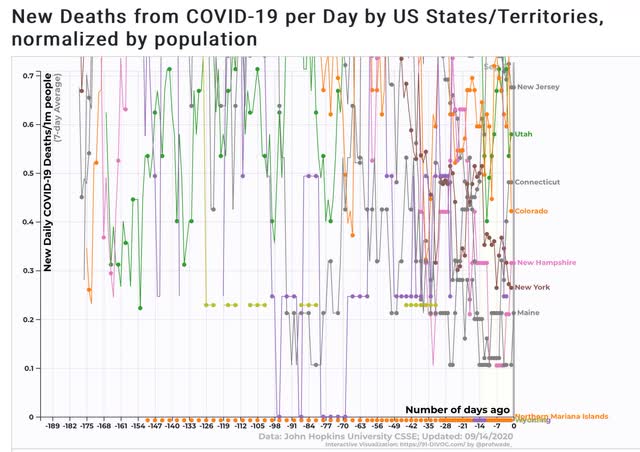
The South (and the territories of Guam and the Virgin Islands) is still leading in deaths per capita:
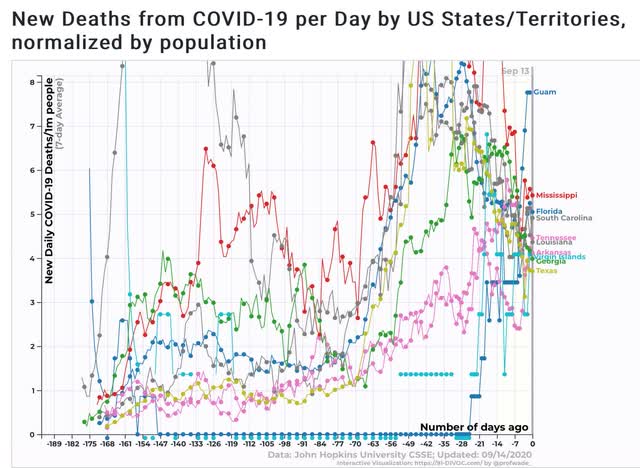
Since the rate of infections in the South, at least officially, has declined, this can be expected to shift to the midwest as well in the next several weeks.
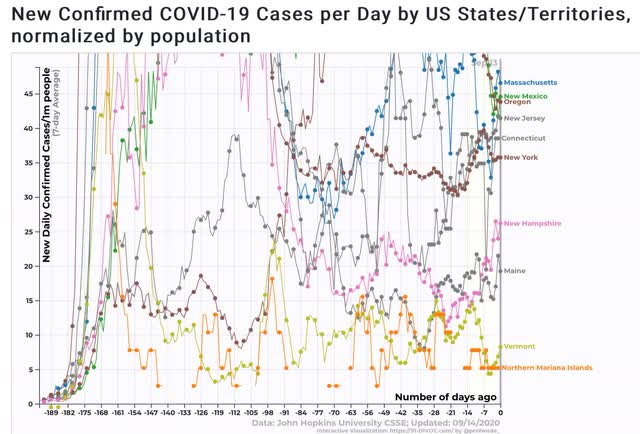
The Bottom 10 States for infections remain dominated by the Northeast, plus several Mountain States
The Bottom 10 for deaths are almost exclusively in the Northeast:
But even the Northeast is stubbornly not doing as well as Canada, as shown in the below graph comparing the rate of NY infections and deaths with Canada’s:
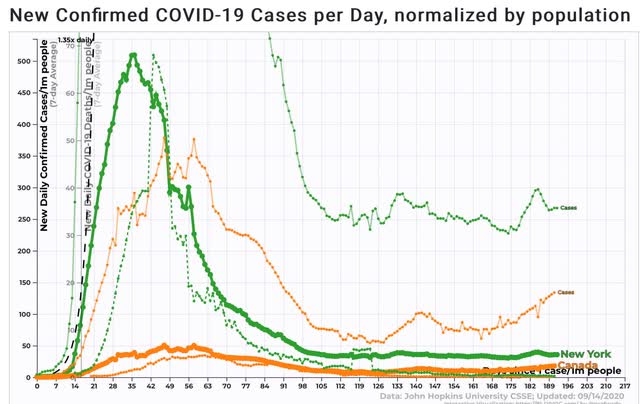
This is depressing, and as I stated at the outset, I do not expect it to change for at least 4 more months.
No worries!
Feds outline sweeping plan to provide free COVID-19 vaccine
AP via @BostonGlobe – September 16
WASHINGTON — The federal government outlined a sweeping plan Wednesday to make vaccines for COVID-19 available for free to all Americans, even as polls show a strong undercurrent of skepticism rippling across the land.
In a report to Congress and an accompanying “playbook” for states and localities, federal health agencies and the Defense Department sketched out complex plans for a vaccination campaign to begin gradually in January or possibly later this year, eventually ramping up to reach any American who wants a shot. The Pentagon is involved with the distribution of vaccines, but civilian health workers will be the ones giving shots.
The campaign is “much larger in scope and complexity than seasonal influenza or other previous outbreak-related vaccination responses,” said the playbook for states from the Centers for Disease Control and Prevention.
Among the highlights:
— For most vaccines, people will need two doses, 21 to 28 days apart. Double-dose vaccines will have to come from the same drugmaker. There could be several vaccines from different manufacturers approved and available.
— Vaccination of the U.S. population won’t be a sprint but a marathon. Initially there may be a limited supply of vaccines available, and the focus will be on protecting health workers, other essential employees, and people in vulnerable groups. The National Academy of Medicine is working on priorities for the first phase. A second and third phase would expand vaccination to the entire country.
— The vaccine itself will be free of charge, and patients won’t be charged out of pocket for the administration of shots, thanks to billions of dollars in taxpayer funding approved by Congress and allocated by the Trump administration.
— States and local communities will need to devise precise plans for receiving and locally distributing vaccines, some of which will require special handling such as refrigeration or freezing. States and cities have a month to submit plans.
Some of the broad components of the federal plan have already been discussed, but Wednesday’s reports attempt to put the key details into a comprehensive framework. Distribution is happening under the umbrella of Operation Warp Speed, a White House-backed initiative to have millions of doses ready to ship once a vaccine is given what’s expected to be an emergency use approval by the Food and Drug Administration. Several formulations are undergoing final trials.
But the whole enterprise is facing public skepticism. Only about half of Americans said they’d get vaccinated in an Associated Press poll taken in May. Of those who wouldn’t get vaccinated, the overwhelming majority said they were worried about safety. To effectively protect the nation from the coronavirus, experts say upwards of 70% of Americans must either be vaccinated or have their own immunity from fighting off COVID-19.
Since the poll, questions have only mounted about whether the government is trying to rush COVID-19 treatments and vaccines to help President Donald Trump’s reelection chances. …
“. . . questions have only mounted about whether the government is trying to rush COVID-19 treatments and vaccines to help President Donald Trump’s reelection chances.”
There is no question that this is a political announcement. Yes, there needs to be planning for the eventual roll-out of one or more vaccine, but the timing of this announcement is pure election politics. Shame.
Joel:
Can I to assume a non replicating viral vector vaccine RNA attaches to the viral RNA not allowing it to replicate?
And 43% of the people approve of his performance. Mind blowing ignorance.
“Trump Death Clock
116,981
Estimated U.S. COVID-19 Deaths Due To POTUS Inaction
In January 2020, the Trump administration was advised that immediate action was required to stop the spread of COVID-19. According to NIAID Director Dr. Anthony Fauci, “there was a lot of pushback” to this advice. President Trump declined to act until March 16th. Experts estimate that, had mitigation measures been implemented one week earlier, 60% of American COVID-19 deaths would have been avoided. (For further reading, click here).”
https://trumpdeathclock.com/
Do not be depressed about the situation. It is not worth the energy being depressed consumes and not merited. And do not expect any major change due solely to our Presidential election winner either. That person is not going to suddenly discover authority akin to that of the Chinese communist regime and also is not going to suddenly have a population of Germans or Austrians instead of Americans trying to follow public health recommendations or edicts. We are closing in on 200,000 deaths, but we are not closing in on 2 million. We did not crush the curve but it was flattened enough so that people are not falling dead on their front lawns in great numbers.
You have several good points Eric, but I continue to remain hopeful that if the MIC and enough of his sycophants get pummeled in November that the maskless, long gun carrying, white supremacist morons will crawl back under their rocks and as a country we can start acting like Canadiens and every other Western democracy. My dad told me that is what happened to all the loud mouthed Nazi sympathizers when the United States entered WWII following the day that will live in infamy—they stfu and the country came together and made the sacrifices necessary to win a war.
COVID-19 vaccine shots to be shipped within 24 hours of approval, CDC says
via @BostonGlobe – September 16
(Bloomberg) — Preparations are underway to ensure that vaccines against COVID-19 will be shipped to administration sites within 24 hours of clearance by U.S. regulators, health officials said.
Federal officials issued guidance to states Wednesday that are designed to speed the path of coronavirus shots to the population, U.S. Centers for Disease Control and Prevention Robert Redfield said in a press conference.
Hundreds of thousands of doses of various candidates, funded by the Trump administration’s Operation Warp Speed program, have already been produced in hope that one or more will prove successful in the clinic. State officials have indicated that they want to make sure that the shots are fully tested and deemed safe and effective before they’re used widely.
The Trump administration has floated the idea of releasing a vaccine to some parts of the public based on limited data, before trials are done, and officials have told states to begin preparing to distribute a vaccine as early as Nov. 1.
Operation Warp Speed named McKesson Corp. to serve as the central distributor of both vaccines and related supplies needed to administer them, the U.S. Department of Health and Human Services announced in August.
The Warp Speed officials assured once again that any Covid-19 vaccine and its administration would be offered to the American public for free.
“No American has to pay a single dime out of pocket for a vaccine,” said Paul Mango, deputy chief of staff for policy at the U.S. Department of Health and Human Services.
Fees for the shot would be covered by commercial insurers, Medicaid, among other entities, and the government is still working out how to cover a small, $3 dollar fee potentially required by Medicare fee-for-service programs, he said.
Just a question – is open anti-semitism accepted at this site?
No, but I am not everywhere and neither do I read everything.
CDC director says most Americans won’t get coronavirus vaccine until mid-2021, prompting rebuke from Trump
Washington Post via @BostonGlobe – September 16
WASHINGTON – The director of the Centers for Disease Control and Prevention predicted Wednesday that most of the American public will not have access to a vaccine against the novel coronavirus until late spring or summer of next year – prompting a public rebuke from President Donald Trump, who declared the CDC chief was wrong.
At a Senate hearing on the government’s response to the pandemic, CDC director Robert Redfield adhered to Trump’s oft-stated contention that a safe and effective vaccine will become available in November or December – perhaps just before the presidential election seven weeks away.
But Redfield said the vaccine will be provided first to people most vulnerable to covid-19, the disease caused by the virus, and supplies will increase over time, with Americans who are lower priority for the protection offered the shot more gradually. For it to be “fully available to the American public, so we begin to take advantage of vaccine to get back to our regular life,” he said, “I think we are probably looking at late second quarter, third quarter 2021.”
Hours later, Trump sought to knock down Redfield’s predicted timeline from the White House press briefing room, saying at a news conference, “I think he made a mistake when he said that. . . . We’re ready to distribute immediately to a vast section of the country.” …
Speaking alongside the president, Scott Atlas, a recent addition to the White House’s coronavirus advisers, noted that the administration Wednesday circulated a vaccine distribution strategy to states and others. Atlas said the plan anticipates that “no later than January, all the top-priority people will be able to receive the vaccine,” with other Americans receiving it starting soon after.
The CDC director issued his prediction and received the presidential drubbing the same day that Democratic presidential nominee Joe Biden raised questions about the safety of a coronavirus vaccine approved during Trump’s tenure, warning something so complex and vital to the public’s well-being takes time.
“Scientific breakthroughs don’t care about calendars any more than the virus does,” the former vice president said.
Redfield said that though any individual vaccinated should benefit from a vaccine, the progressive widening of its availability means there will be a time lag between when a vaccine is approved and when it could have a measurable effect in controlling the pandemic. That might be six to nine months after the day it is approved by federal drug regulators, Redfield predicted.
Redfield said that lag between when a vaccine is approved and when the public can get it reinforces the importance of safety measures, such as keeping a proper distance, washing hands and wearing masks.
“I might even go so far as to say that this face mask is more guaranteed to protect me against covid than when I take a covid vaccine,” Redfield said, because the vaccine is unlikely to produce the desired immune response in everyone who gets it. …
But Trump at his briefing continued to cast doubt on the value of masks, saying, “The mask is a mixed bag.”
Redfield’s comments were the most detailed time frame outlined so far by the leader of the government’s main public health agency. They are consistent with the perspective of Anthony Fauci, director of the National Institute of Allergy and Infectious Diseases, who said in a recent interview with CNN that relatively small amounts of vaccine will be available at first.
“It won’t be until we get into 2021 that you’ll have hundreds of millions of doses, and just the logistics, constraints in vaccinating large numbers of people,” Fauci said. “It’s going to take months to get enough people vaccinated to have an umbrella of immunity over the community so that you don’t have to worry about easy transmission.”
Redfield’s forecast came as Trump has latched onto the prospect of a vaccine as crucial to his prospects for a second term, with low approval ratings among voters for his handling of the worst public health crisis that the country and world have confronted in a century. …
run75441
thanks, but I think this is a repeat offence and it really grates.
reason:
I keep trying to keep this a tolerant place of all views and school some in how not to be offensive to others by what they say. I am not the kindest person here at AB. Give me time. My tolerance is decreasing.
‘Herd mentality’: Trump says US ’rounding the corner’ on coronavirus, doctors and scientists disagree
via USAToday – September 15
WASHINGTON – President Donald Trump claimed Tuesday during a televised town hall that “herd mentality” could make the coronavirus “disappear” with or without a vaccine.
During a 90-minute town hall hosted by ABC News in the must win battleground of Pennsylvania, Trump defended his repeated assertion that the virus will eventually disappear even without a vaccine, citing what he called “herd mentality,” an apparent reference to “herd immunity.”
ABC News’ Chief Anchor George Stephanopoulos asked Trump whether the coronavirus “would go away without the vaccine?”
“Sure, over a period of time. Sure, with time it goes away –” Trump responded.
Stephanopoulos interjected: “–And many deaths.”
“And you’ll develop, you’ll develop herd — like a herd mentality. It’s going to be — it’s going to be herd developed – and that’s going to happen. That will all happen,” Trump said.
Herd immunity is the theory that the virus is eradicated only after a high percentage of the population is infected, limiting its ability to spread.
Herd mentality, also known as mob mentality, rather means people can be influenced by the “herd” to act in ways that are emotional, rather than rational.
Dr. Anthony Fauci, Director of the National Institute of Allergy and Infectious Diseases at the National Institutes of Health, who is the nation’s leading infectious disease expert, has said the “death toll would be enormous” if the country attempted herd immunity. …
(Hmmm. ‘Herd mentality’ is when a yoooge group decides that since
he won’t leave office if he loses on Nov 3, the best course is to
vote him back in just to avoid hassles. Thus achieving ‘herd
immunity’ also/maybe/hopefully. Sounds like a plan…)