This Friday morning two important indicators for July, with implications for future employment, were released: retail sales and industrial production.
Retail sales for July increased 0.8% on an unadjusted basis. After adjusting for inflation, they rose 0.7%. In the past two months they have completely recovered to higher than their pre-pandemic levels:
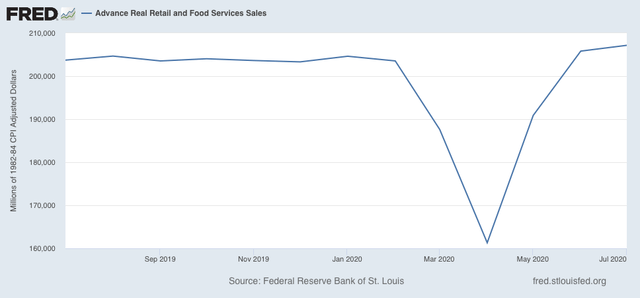
Since consumption is about 70% of the entire US economy, this constitutes good news.
Meanwhile, industrial production, the King of Coincident Indicators, also rose sharply, by 3.0%. Manufacturing production rose by 3.4%. As a result, total production has recovered 50% of its lost ground to the pandemic, while manufacturing production has recovered 60%:
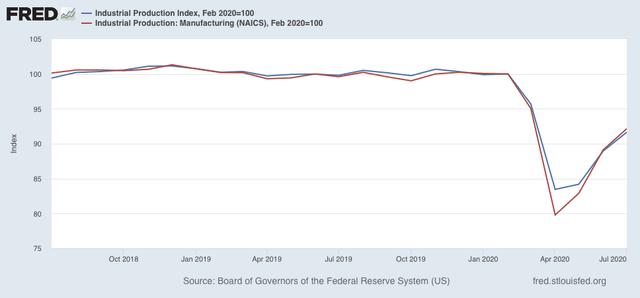
Note that production actually peaked in summer 2018, and was already on a slightly fading trajectory thereafter before the pandemic hit.
Thus, three of the four monthly coincident indicators (including employment) used by the NBER to determine if the US is in recession or not, all indicate that July marked the 3rd month of a recovery. Note they do *not* forecast whether the recovery will last – they are nowcasting tools only.
As noted above, both retail sales and industrial production do have implications for future employment.
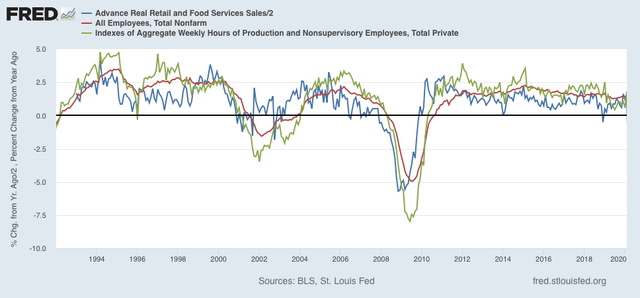
Going back over half a century, consumption leads employment. More specifically, real retail sales (blue in the graphs below) tend to lead employment (red) by 3 to 6 months. They are an even better fit for aggregate hours worked (green) 3 to 6 months in the future.
Here is the past 25+ years through February:
And here is this year through July:
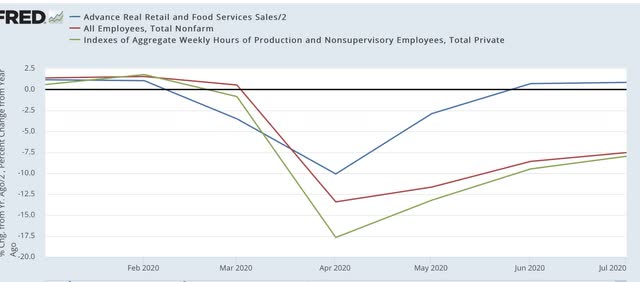
The recovery in sales suggests that total hours of employment and the number of jobs will both continue to increase in the next few months.
Meanwhile, since the early 1980s manufacturing production (red in the graph below) has generally led employment in manufacturing (gold).
Here’s the last 13 years:
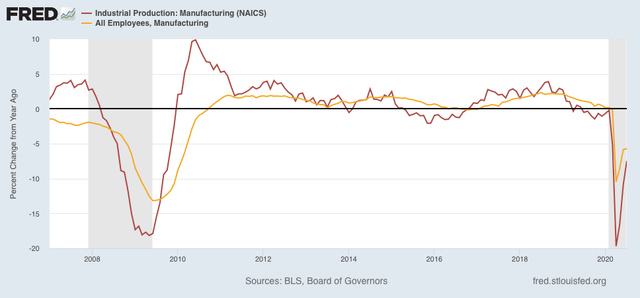
The increase in manufacturing suggests that manufacturing employment, itself a leading indicator for total employment, will pick up steam in the next few months.
The huge monkey wrench in the works, of course, is the termination of Congress’s supplemental unemployment assistance. I am expecting a sharp slowdown in sales as a result beginning this month, with all of the negative consequences that typically follow.


i don’t know where he gets this: Retail sales for July increased 0.8% on an unadjusted basis. After adjusting for inflation, they rose 0.7%.
i wish he would provide a link to the source he’s looking at…
here’s the retail sales report: https://www.census.gov/retail/marts/www/marts_current.pdf
quoting: Advance estimates of U.S. retail and food services sales for July 2020, adjusted for seasonal variation and holiday and trading-day differences, but not for price changes, were $536.0 billion, an increase of 1.2 percent (± 0.5 percent) from the previous month, and 2.7 percent (± 0.7 percent) above July 2019.
unadjusted sales (see table) actually rose 3.0%, from $536,142 million in June to $552,472 million in July.
June sales were revised 1.0% higher, May sales were revised 0.1% higher. i figure that adds 24 basis points to 2nd quarter GDP when the revision comes out Aug 27…it also raises the bar for 3rd quarter to climb.
i still can’t see how he gets sales up 0.8%, and up 0.7% after adjusting for inflation…even his usual “real sales” metric from FRED, which adjusts sales (+1.2%) with CPI (+0.6%) would give inflation adjusted sales of +0.6%…
FYI, here’s how i figured real retail for July, complete with my caveat:
To compute July’s real personal consumption of goods data for national accounts from this July retail sales report, the BEA will use the corresponding price changes from the July consumer price index, which we just reviewed….to estimate what they will find, we’ll first pull out the usually volatile sales of gasoline from the other totals…from the third line on the above table, we can see that July retail sales excluding the 6.2% jump in sales at gas stations were up by 0.9%….then, subtracting the figures representing the 0.2% increase in grocery & beverage sales and the 5.0% increase in food services sales from that total, we find that core retail sales were up by somewhat less than 0.5% for the month…since the July CPI report showed that the the composite price index of all goods less food and energy goods was 0.7% higher in July, we can thus figure that real retail sales excluding food and energy, or real core PCE, will show an decrease of about 0.2% for the month…however, the actual adjustment in national accounts for each of the types of sales shown above will vary by the change in the related price index…for instance, while nominal sales at motor vehicle & parts dealers were down 1.2%, the July price index for transportation commodities other than fuel was 1.4% higher, which would suggest that real sales at auto & parts dealers were 2.6% lower once price increases are taken into account… similarly, while nominal sales at clothing stores were 6.2% higher in July, the apparel price index was 1.1% higher, which means that real sales of clothing only rose around 5.0%…
In addition to figuring those core retail sales, to make a complete estimate of real July PCE, we’ll need to adjust food and energy retail sales for their price changes separately, just as the BEA will do…the July CPI report showed that the food price index was 0.4% lower, as the price index for food purchased for use at home fell 1.1% while the index for food bought away from home was 0.5% higher…thus, while nominal sales at food and beverage stores were 0.2% higher, real sales of food and beverages would have been around 1.3% higher in light of the 1.1% decrease in prices…meanwhile, the 5.0% increase in nominal sales at bars and restaurants, once adjusted for 0.5% higher prices, suggests that real sales at bars and restaurants actually rose around 4.5% during the month…at the same time, while sales at gas stations were up 6.2%, there was concurrently a 5.6% increase in the price of gasoline during the month, which would suggest that real sales of gasoline were only on the order of 0.6% higher, with a caveat that gasoline stations sell more than gasoline, and we haven’t accounted for those other sales…by averaging those estimated real sales figures with a sales appropriate weighting, and excluding food services, we’d estimate that the income and outlays report for July will show that real personal consumption of goods were close to unchanged in July, after rising by a revised 6.7% in June and after rising by a revised 14.2% in May, but after falling by 12.5% in April, 0.7% in March, and 0.4% in February…at the same time, the 4.5% increase in real sales at bars and restaurants should have a noticable positive impact on July’s real personal consumption of services…
We want to caution that the shortcut method that we’ve used here to make these estimates is likely prone to more inaccuracies than usual, given the unbalanced and wide range of changes in each of the types of sales in this month’s report, but we opted to go ahead with it anyhow for illustrative purposes…another reason for caution with this rebound in retail sales is that not all of it will make it to the bottom line of GDP…for instance, if a substantial portion of July’s auto sales came out of inventories of vehicles that were not sold in March and April, the corresponding reduction of inventories will subtract from GDP by the same amount that the increased sales added to it…similarly, if the increased electronics, appliance and clothing store sales came from imported goods, the corresponding imports of electronics, appliances and clothing will subtract from GDP by the same amount that the increased sales of those goods added to it….the only increases in retail sales that add to GDP without an offset are those that indicate an increase in the amount of goods produced for those sales domestically; in general, goods in that catagory would include in the increased sales of groceries, gasoline, and building materials…moreoever, since Covid 19 is a services recession, personal consumption of services, which accounts for 47% of each month’s GDP, will be much more important in tracking the trajectory of the economy…..for that, we’d have to know if health care services, transportation services, recreation services, education services and food services and accommodations have increased or not over the month, and then vis-a-vis the last quarter… indications are that they have not…
except for the last link to McBride, the other links are to show my math…
lol, that isn’t up strongly. Your forgetting yry crashed in March/April. Its still only up real 1.7% yry. A decline in August/September is a sure bet. Wiping out the gains.
On the other hand, what makes people expect a job recovery? Recessions are discovery mechanisms for minimal staffing.