– by New Deal democratThere’s no big economic news out today. So let me follow up on my post Friday about the cost of reopening recklessly coming due.
Here is the graph from 91.divoc.com of the 10 States with the highest per capita infection rate over the past 7 days ending Saturday:
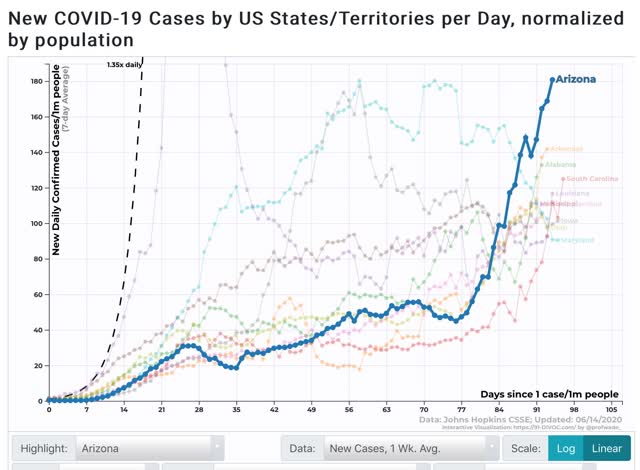
With the exception of rapidly declining Maryland, the focus has almost entirely shifted away from the Northeast and Midwest and instead to the Confederacy plus Iowa, Utah, and Arizona. The 4 “leading” States are Arizona, Alabama, Arkansas, and South Carolina.
I’m having problems with the 91-divoc site this morning, but the raw data through Sunday shows a slight decline for Arizona, but a 12% increase for Alabama and a whopping 25% increase for Arkansas, bringing it up to Arizona’s level. South Carolina is steady.
Among the other States with recent big increases, North Carolina saw a 6% further increase as of Sunday. Utah and Iowa had slight increases. Mississippi had a 13% decrease in the 7 day average.
Finally, although they aren’t among the 10 States with the highest per capita new infections, both Florida and Texas have also seen big increases in cases in the past two weeks (both have had about 60 cases per million per day as of several days ago). Through Sunday, Florida’s rate increased another 8%, while Texas saw another 3% increase.
Bear in mind that, at its worst, NY had over 500 new infections per day per million population, so even Arizona and Arkansas are less than 40% of that rate. It remains to be seen how much pain these States can take before they decide to change their ways – if ever.
https://www.nytimes.com/2020/06/15/world/coronavirus-live-updates.html
June 15, 2020
The F.D.A. withdrew emergency approval for malaria drugs promoted by Trump.
The Food and Drug Administration said Monday that it was revoking emergency authorization of two malaria drugs to treat Covid-19, saying that they are “unlikely to be effective.”
The drugs, hydroxychloroquine and a related drug, chloroquine, were heavily promoted by President Trump after a handful of small, poorly controlled studies showed that they could work in treating the disease.
June 15, 2020
Coronavirus
US
Cases ( 2,170,136)
Deaths ( 117,951)
UK
Cases ( 296,857)
Deaths ( 41,736)
Canada
Cases ( 99,070)
Deaths ( 8,174)
Sweden
Cases ( 52,383)
Deaths ( 4,891)
June 15, 2020
Coronavirus (Deaths per million)
Belgium ( 834)
UK ( 615)
Spain ( 580)
Italy ( 568)
Sweden ( 484)
France ( 451)
US ( 356)
Netherlands ( 354)
Ireland ( 346)
Switzerland ( 224)
Canada ( 217)
Luxembourg ( 176)
Portugal ( 149)
Germany ( 106)
Denmark ( 103)
Austria ( 75)
Finland ( 59)
Norway ( 45)
Greece ( 18)
https://www.globaltimes.cn/content/1191706.shtml
June 15, 2020
Beijing outbreak may be more infectious than Wuhan one, rich anti-epidemic experience in place: virologist
By Ni Hao
________________________________
The coronavirus found in Beijing’s Xinfadi wholesale market is probably more infectious than those detected in Wuhan’s Huanan seafood market, where the first wave of epidemic in the country was detected, given a significant number of cases confirmed in only four days in the capital city, a virologist said on Monday.
Yang Zhanqiu, deputy director of the pathogen biology department at Wuhan University, told the Global Times on Monday that the 79 cases were confirmed in four days, showing the coronavirus found in Beijing is extremely contagious, likely more contagious than that found in Wuhan.
A researcher from the Beijing Center for Diseases Prevention and Control (Beijing CDC) told China Central Television (CCTV) in a telephone interview that the genome sequencing of the strain of the coronavirus which caused the new COVID-19 outbreak in Beijing at the Xinfadi wholesale food market shows it originated from Europe.
Yang said that if the type of coronavirus spreading in Beijing matches the type of virus sampled in the Xinfadi market and from Europe, then it is safe to say that the virus found in Beijing was “brought into” China by food or people from Europe. He is inclined to define the local outbreak in Beijing Xinfadi market as an imported outbreak.
Yang said the genome sequencing is like testing human DNA. The genotype of the virus does not mutate in the short term. The mutation usually occurs after two or three years, to even 10 or 20 years. And different virus test results show different genotypes, with the detection of the difference easy to tell.
As of Monday, authorities have screened nearly 200,000 people who had been to Xinfadi wholesale market, where the latest cluster occurred.
Yang noted that Wuhan’s Health Commission began releasing reports at the end of December, adding that the number of reported cases had reached 62 by January 17, which is close to the number of newly confirmed cases in Beijing. Although the test sample was large enough and the technical ability was strong, the fact that 79 patients were diagnosed in four days in Beijing is still exceeding the expectations.
The outbreak in Wuhan was at a low temperature in winter, which was conducive to the spread of the virus. It is summer in Beijing, which is not conducive to the spread of the virus, he added.
What makes people optimistic is that China has accumulated rich experience in epidemic prevention and a strong joint prevention mechanism, and quickly adopted measures to contain the epidemic, Yang said.
Yang believes that different types of viruses bring new challenges to the development of vaccines.
“No doubt different genotypes of the virus can cause the vaccine to be less effective, or even ineffective. That means the vaccine would have to be effective against both viruses circulating in China and those in Europe, adding difficulty to developing a vaccine,” Yang explained.
Different types of a virus may cause different symptoms or increase the difficulty of treatment, which has not been confirmed yet. However, Yang is quite sure that the European genotype will not affect the development of effective drugs for COVID-19.
As for the controversial question of the origin of the virus, Yang said that previous studies have shown that the coronavirus does not infect aquatic organisms such as fish, and there is little possibility for salmon to serve as an intermediate host.
There is a possibility that aquatic products or beef, mutton and poultry were contaminated by patients during processing abroad and brought into China through the cold chain.
“China has effectively contained the outbreak, but it was surprising that Beijing was suddenly tested by a local outbreak,” Yang said, adding that, “China’s epidemic prevention has always focused on the arrival of overseas personnel, and now we should pay enough attention to the customs quarantine of imported agricultural products.”
https://medium.com/incerto/the-masks-masquerade-7de897b517b7
June 14, 2020
The Masks Masquerade
By Nassim Nicholas Taleb
Incompetence and Errors in Reasoning Around Face Covering
SIX ERRORS: 1) missing the compounding effects of masks, 2) missing the nonlinearity of the probability of infection to viral exposures, 3) missing absence of evidence (of benefits of mask wearing) for evidence of absence (of benefits of mask wearing), 4) missing the point that people do not need governments to produce facial covering: they can make their own, 5) missing the compounding effects of statistical signals, 6) ignoring the Non-Aggression Principle by pseudolibertarians (masks are also to protect others from you; it’s a multiplicative process: every person you infect will infect others).
In fact masks (and faceshields) supplemented with constraints of superspreader events can save us trillions of dollars in future lockdowns (and lawsuits) and be potentially sufficient (under adequate compliance) to stem the pandemic. Bureaucrats do not like simple solutions….
anne:
You beat me to this one also. I will post a pic to emphasize your comment on the effectiveness of masks. University of Cambridge has a nice study out. Follow the link on this site: Widespread facemask use could shrink the ‘R’ number and prevent a second COVID-19 wave – study
“Bear in mind that, at its worst, NY had over 500 new infections per day per million population, so even Arizona and Arkansas are less than 40% of that rate.”
This is true but not necessarily relevant–NYC and its environs have a relatively high hospital capacity, most especially including ICUs.
Reports out of Arizona show them rather near, or even at, the limits of their capacity, while Governor “Drop a” Ducey does his imitation of the three monkeys.
Ken:
Good point to remember. We are looking at AZ to move too.
From Run:
https://royalsocietypublishing.org/doi/10.1098/rspa.2020.0376
June 10, 2020
A modelling framework to assess the likely effectiveness of facemasks in combination with ‘lock-down’ in managing the COVID-19 pandemic
By Richard O. J. H. Stutt, Renata Retkute, Michael Bradley, Christopher A. Gilligan and John Colvin
Abstract
COVID-19 is characterized by an infectious pre-symptomatic period, when newly infected individuals can unwittingly infect others. We are interested in what benefits facemasks could offer as a non-pharmaceutical intervention, especially in the settings where high-technology interventions, such as contact tracing using mobile apps or rapid case detection via molecular tests, are not sustainable. Here, we report the results of two mathematical models and show that facemask use by the public could make a major contribution to reducing the impact of the COVID-19 pandemic. Our intention is to provide a simple modelling framework to examine the dynamics of COVID-19 epidemics when facemasks are worn by the public, with or without imposed ‘lock-down’ periods. Our results are illustrated for a number of plausible values for parameter ranges describing epidemiological processes and mechanistic properties of facemasks, in the absence of current measurements for these values. We show that, when facemasks are used by the public all the time (not just from when symptoms first appear), the effective reproduction number, Re, can be decreased below 1, leading to the mitigation of epidemic spread. Under certain conditions, when lock-down periods are implemented in combination with 100% facemask use, there is vastly less disease spread, secondary and tertiary waves are flattened and the epidemic is brought under control. The effect occurs even when it is assumed that facemasks are only 50% effective at capturing exhaled virus inoculum with an equal or lower efficiency on inhalation. Facemask use by the public has been suggested to be ineffective because wearers may touch their faces more often, thus increasing the probability of contracting COVID-19. For completeness, our models show that facemask adoption provides population-level benefits, even in circumstances where wearers are placed at increased risk. At the time of writing, facemask use by the public has not been recommended in many countries, but a recommendation for wearing face-coverings has just been announced for Scotland. Even if facemask use began after the start of the first lock-down period, our results show that benefits could still accrue by reducing the risk of the occurrence of further COVID-19 waves. We examine the effects of different rates of facemask adoption without lock-down periods and show that, even at lower levels of adoption, benefits accrue to the facemask wearers. These analyses may explain why some countries, where adoption of facemask use by the public is around 100%, have experienced significantly lower rates of COVID-19 spread and associated deaths. We conclude that facemask use by the public, when used in combination with physical distancing or periods of lock-down, may provide an acceptable way of managing the COVID-19 pandemic and re-opening economic activity. These results are relevant to the developed as well as the developing world, where large numbers of people are resource poor, but fabrication of home-made, effective facemasks is possible. A key message from our analyses to aid the widespread adoption of facemasks would be: ‘my mask protects you, your mask protects me’.
Notice the elegance of the argument by Nassim Nicholas Taleb:
https://medium.com/incerto/the-masks-masquerade-7de897b517b7
June 14, 2020
The Masks Masquerade
By Nassim Nicholas Taleb
First error: missing the compounding effect
People who are good at exams (and become bureaucrats, economists, or hacks), my experience has been, are not good at understanding nonlinearities and dynamics.
The WHO, CDC and other bureaucracies initially failed to quickly realize that the benefits of masks compound, simply because two people are wearing them and you have to look at the interaction.
Let us say (to simplify) that masks reduce both transmission and reception to p. What effect on the R0 (that is, the rate of spreading of the infection)?
Simply the naive approach (used by the CDC/WHO bureaucrats and other imbeciles) is to say if masks reduce the transmission probability to ¼, one would think it would then drop from, say R0= 5, to R0=1 ¼. Yuuge, but there is better.
For one should count both sides. Under our simplification, with p=1/4 we get R0’= p² R0 . The drop in R becomes 93.75%! You divide R by 16! Even with masks working at 50% we get a 75% drop in R0.
Second error: Missing the Nonlinearity of the Risk of Infection
The error is to think that if I reduce the exposure to the virus by, say, ½, I would then reduce the risk, expressed as probability of infection, by ½ as well. Not quite.
Now consider * that probability must follow a nonlinear dose-response, an “S curve”. In the convex part of the curve, gains are disproportionately large: a reduction of x% of viral exposure leads to a drop of much more than x in risk of infection. And, patently we are in the convex part of the curve. For example, to use the case above, a reduction of viral load by 75% for a short exposure could reduce the probability of infection by 95% or more!
* https://miro.medium.com/max/1000/1*XV3AU17D7-rJ2Z8lZE3pWw.png
Third Error: Mistaking Absence of Evidence for Evidence of Absence
“There is no evidence that masks work”, I kept hearing repeated to me by the usual idiots calling themselves “evidence based” scientists. The point is that there is no evidence that locking the door tonight will prevent me from being burglarized. But everything that may block transmission could help. Unlike school, real life is not about certainties. When in doubt, use what protection you can. Some invoked the flawed rationalization that masks induce false confidence: in fact there is a strong argument that masks makes one more alert to the risks and more conservative in behavior.
Fourth Error: Misunderstanding the Market and People
Paternalistic bureaucrats resisted inviting the general public to use masks on grounds that the supply was limited and would be needed by health professionals — hence they lied to us saying “masks are not effective”. They did not get the inventiveness and industriousness of people who do not need a government to produce masks for them: they can rapidly convert about anything into well-functioning protective face covering appendages, say rags into which one can stitch coffee filters… about anything. Nor did bureaucrats heed the notion of markets and the existence of opportunists who can supply people with what they want.
Fifth Error: Missing Extremely Strong Statistical Signals
Many people who deal with statistics think in terms of either mechanistic concepts (say correlation) they don’t quite understand, or local results; they fear to be presenting “anecdotes”, and fail to grasp the broader notion of statistical signals where you look at the whole story, not the body parts. For here, again, evidence compounds. We have a) the salon story where two infected stylists failed to infect all their 140 clients (making the probability of infection for bilateral mask wearing safely below 1% for a salon-style exposure) — we know the probability of infection for non mask wearers from tens of thousands of data points and the various R0 estimations) plus b) the rate of infection of countries where masks were mandatory, plus c) tons of papers with more or less flawed methodologies, etc.
Sixth Error: The Non-Aggression Principle
“Libertarians” (in brackets) are resisting mask wearing on grounds that it constrains their freedom. Yet the entire concept of liberty lies in the Non-Aggression Principle, the equivalent of the Silver Rule: do not harm others; they in turn should not harm you. Even more insulting is the demand by pseudolibertarians that Costco should be banned from forcing customers to wear masks — but libertarianism allows you to set the rules on your own property. Costco should be able to force visitors to wear pink shirts and purple glasses if they wished.
Note that by infecting another person you are not infecting just another person. You are infecting many many more and causing systemic risk.
Wear a mask. For the Sake of Others….
Heavy rumors trump had a stroke.
I had a joke of exceedingly poor taste that I almost posted here.
“It remains to be seen how much pain these States can take before they decide to change their ways – if ever.” Given the rhetoric over the last 4 months from our right-wing “leaders” I would guess that NEVER has always been and continues to be their choice regarding measures to control COVID19.
June 15, 2020
Coronavirus
US
Cases ( 2,182,950)
Deaths ( 118,283)
UK
Cases ( 296,857)
Deaths ( 41,736)
Identifying airborne transmission as the dominant route for the spread of COVID-19
By Renyi Zhang, Yixin Li, Annie L. Zhang, Yuan Wang, and Mario J. Molina
PNAS June 11, 2020
https://www.pnas.org/content/early/2020/06/10/2009637117
Significance
We have elucidated the transmission pathways of coronavirus disease 2019 (COVID-19) by analyzing the trend and mitigation measures in the three epicenters. Our results show that the airborne transmission route is highly virulent and dominant for the spread of COVID-19. The mitigation measures are discernable from the trends of the pandemic. Our analysis reveals that the difference with and without mandated face covering represents the determinant in shaping the trends of the pandemic. This protective measure significantly reduces the number of infections. Other mitigation measures, such as social distancing implemented in the United States, are insufficient by themselves in protecting the public. Our work also highlights the necessity that sound science is essential in decision-making for the current and future public health pandemics.
The receptive effectiveness of masks probably is lower than the effectiveness of masks transmitting virus. Infection is not limited to immediately inhaling the virus. The “wash hands, don’t touch face” factors still address major vectors. if you don’t use new or well-washed masks simply handling it has a risk. There is some kind of compounding effect, but not likely to be equal, so squaring the impact on transmission probably overstates the benefit.