Coronavirus dashboard for April 11: new high in daily infections as testing falls further behind
Coronavirus dashboard for April 11: new high in daily infections as testing falls further behind
Here is the update through yesterday (April 10)
I’ve changed the format, moving the “just the facts, ma’am” data to the top, and comments to the end. Significant new developments are indicated in italics.
The four most important metrics are starred (***) below.
Number and rate of increase of Reported Infections (from Johns Hopkins via arcgis.com)
-
- Number: up +35,219 to 501,615 (vs. 33,958 prior peak on April 9)
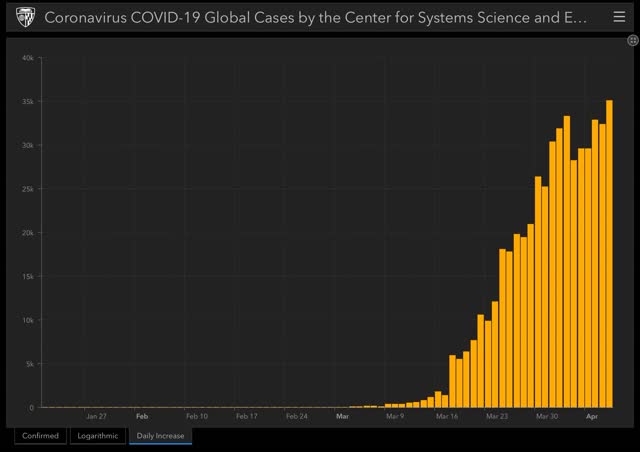
- ***Rate of increase: day/day: 8% (vs. 9% for the past week, and 8% on April 9)
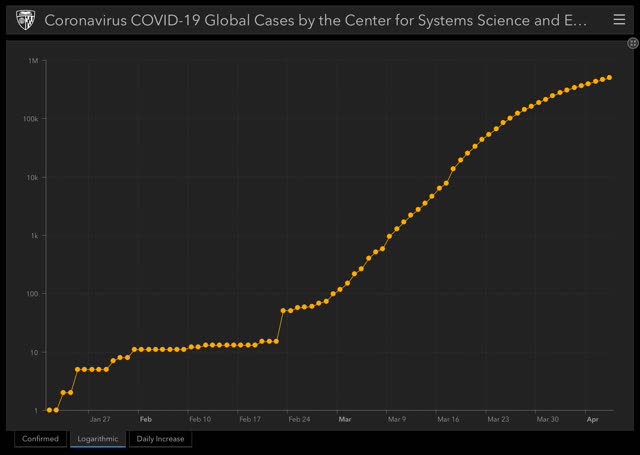
The exponential growth rate began to fall from 35% on March 24. In the past two weeks it was in a slowly decelerating trend of between -0.5% and -1%/day. In the past 5 days that has nearly come to a halt.
It’s not clear if this is a shortcoming in State lockdowns which appeared to have been working, or a shortcoming in testing, but I strongly lean towards the latter explanation.
Ben Engebreth is tracking coronvirus infection and testing numbers for each State, with graphs, here. Also, there is an awesome interactive tool to measure infections and other data for various countries and US States at 91-divoc.com.
<Number of deaths and infections and rate of increase of testing (from COVID Tracking Project)
- ***Number of deaths: Total 18,488, up +2,089 day/day
- Rate: increase of 13% day/day vs. average of 15% in past week
- Number of tests: 153,514 down -9,255 day/day, new daily high for non-“pending” tests
- Rate: decrease -6% vs. number of tests previous day
- Tests pending result: 17,631 vs. 17,631 on April 9 day/day
Comparison of rates of increase in documented infections vs. testing
- Infections +8% vs. Tests -6% day/day
Result: The rate of testing appeared to be catching up a little bit to the spread of the virus, but stalled again in the past week at about 140,000/day. It remains far below what is needed, which is probably now at least 250,000/day, and is falling further behind.
Ratio of tests to positives for infection (from COVID Tracking Project)
- Number: 153,514 new tests vs. 34,204 new diagnosed infections
- ***Ratio: 4.5:1
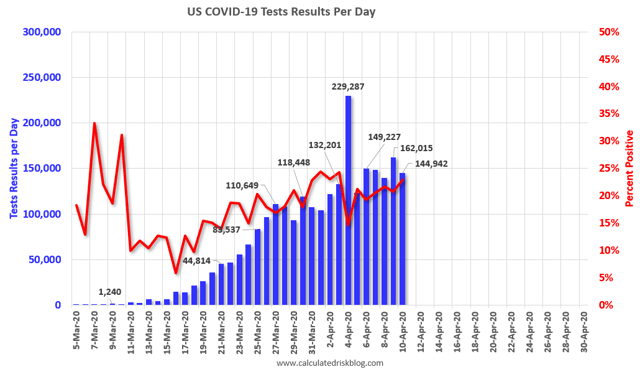
In South Korea, the inflection point where the number of new daily cases plateaued was reached when the ratio of tests to new cases found reached 15:1. Any ratio less than that suggests that not enough testing is being done. Yesterday’s ratio of 4.5:1 is not only far behind, but has gotten worse in the past 7 days. Along with a number of others, I am very concerned that insufficient testing is hiding the increasing spread of the virus. That the percentage of positive results to total tests keeps rising only heightens that concern — i.e., we are not finding new potential breakouts. Yesterday’s pattern – decreasing tests with the highest ever number of positives – is the worst situation.
US States and population in total lockdown, business lockdown, and partial restrictions – no changes in past 24 hours
- ***Total lockdown: 43 States, 306.7 million, 92.4%
- ***Business lockdown: 2 States (KY, MA^^) 14.4 million, 4.3%
- Partial restrictions on business (bars, restaurants): 5 States (IA, ND^, NE, UT*^, WY^) 9.7 million, 2.9%
- School closure only: 2 States (AR^, SD*) 3.9 million, 1.2%
- No mandatory restrictions: NONE
*some local areas under lockdowns
^restrictions on or quarantine of travelers from out of State
^^mandatory quarantine of persons attending Easter services(!)
There have been no meaningful changes in the past day.
]US States with “test, trace, and quarantine” programs
- Under development: 6 States: CT, MA, MD, NJ, NY, UT
Summary for April 10
The best public health strategy is that of a temporary total lockdown to turn the new infection rate negative while the production and distribution of necessary medical equipment to treat existing cases and for a massive “test, trace, and quarantine” to be put in place.
Here’s how we stand (meaningful new developments in italics):
- About 95% of the total US population is under total lockdown.
- Yesterday the US recorded a new high in daily new infections.
- Mandatory lockdowns have brought the rate of growth in new infections down to just below 8%/day, but this deceleration has stalled in the past week. Most likely, this is because of the next bullet point.
- The number of daily tests appears to have stalled again at about 140-150,000. As a result, we appear to be missing an increasing number of actual new infections.
- The Trump Administration has still not mandated a nationwide lockdown, and in fact appears to want to “open up” society on or by May 1, even without a testing regimen in place.
- The Trump Administration has taken no meaningful steps to mandate mass production of necessary medical equipment.
- The Trump Administration has taken no steps towards a nationwide “test, trace, and quarantine” plan that will be needed to lift lockdowns, or to assist States to do so.
- In the absence of federal action, various States are either coordinating in making purchases of the necessary equipment, and/or to develop their own “test, trace, and quarantine” plan.
- Until States or the federal government implement a regimen of “test, trace, and quarantine,” lockdowns cannot be lifted.
- Kentucky’s governor has announced that people who disregard the State’s social distancing order to attend Easter services will be placed in quarantine.
- Google and Apple have premiered an app under development that will trace coronavirus contacts