The Stock Market in Presidential Terms
Before the recent swoon stock market market performance under Trump had been quite favorable. The market gain since his inauguration (100) had been (144) similar to those under Clinton (141) and Obama (150). At this point Ike actually had the best return ( 170) but Ike and Truman are not included in the chart because it is too cluttered already.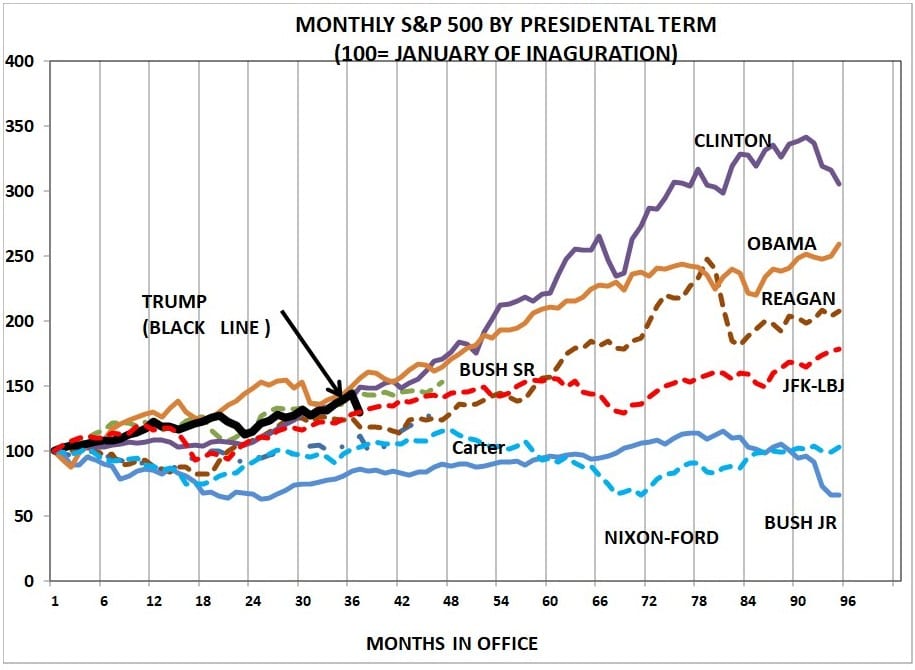
After the recent market drop he is now more or less in the middle of the pact for recent presidents — even with JFK-LBJ and behind most democrats and ahead of most republicans.
But if he wants a strong market-economy going into the election it is easy to see why he strongly favors the 50 basis point cut by the Fed. The market doesn’t seem quite sure what to make of the Fed’s actions, first rallying strongly and then turning negative. It still does not have a handle om what economic impact to expect from the coronavirus. Maybe the Fed fears a bigger impact than markets were already discounting. Or, maybe the Fed is just taking out insurance in the face of extreme uncertainty.
the last observation on the chart is Friday, 29 Feb.
Rate cuts don’t do anything in a credit contraction. Matter of fact, they make it worse. Might as well go to negative rates and really screw things up.
The effective Fed rate should have been 400bps or more considering the rate of inflation was in the low 2’s. If the Fed rate isn’t high enough, it robs from the productive economy and stimulates credit bubbles. This has shown itself 2 straight cycles. The first in subprime mortgages and now subprime consumer loans(which hopefully won’t have the same contagion effect).
Lets also note, the effective rate being about 2% above the rate of inflation is a JMK belief.