Five Charts, Graphs, Depictions to Help Explain What Voters are Thinking about Health Care – Election 2020
KFF Health Tracking Poll – February 2020: Health Care in the 2020 Election
As SCOTUS decides (this last Friday) whether it will take up he ACA and its constitutionality in Texas v. United States challenging the constitutionality of the 2010 Affordable Care Act (ACA), the
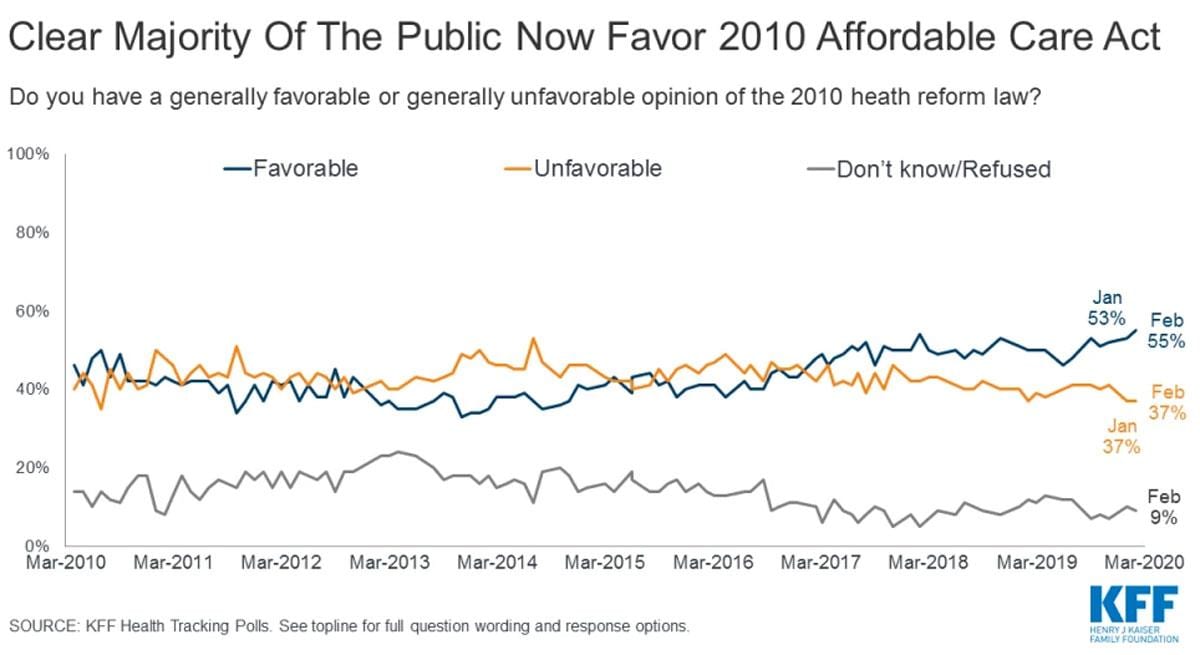 attitude of the public towards it has changed since the 2016 election. The February 2020 KFF Health Tracking Poll finds attitudes towards the ACA hit its highest favorability rating since KFF began tracking opinions ~ ten years ago. The poll finds a clear majority of the public viewing the law favorably (55%), while slightly more than one-third (37%) of the public hold unfavorable views. In my own opinion, much of this change in attitude is the result of the rising patient costs of healthcare due to pricing increases, increased commercial healthcare costs, and the elimination of the CSR subsidies which also impacted people above 400% FPL in income causing many of them to drop healthcare insurance.
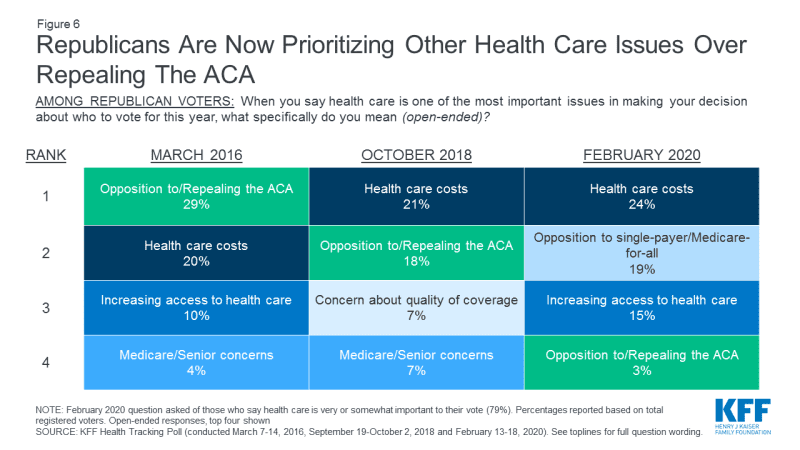
Attitudes amongst Republicans have also changed (chart to the left) from 2016 t0 2020 with a greater priority being given to lowering healthcare cost over repealing the ACA. Most Republican voters (84%) hold unfavorable views towards the ACA; however, few offer up the ACA when asked to describe in their own words what about health care is important to their vote. Three percent of Republican voters offer opposition to or repealing the ACA as their top health care issue down from 2016. Twenty-four percent now list healthcare costs as their number one issue.
Attitudes amongst all voters towards the Affordable Care Act during the 2020 presidential election is quite different than how it was in 2016. As always click on the graph to enlarge. Beyond the leap, what is favored.
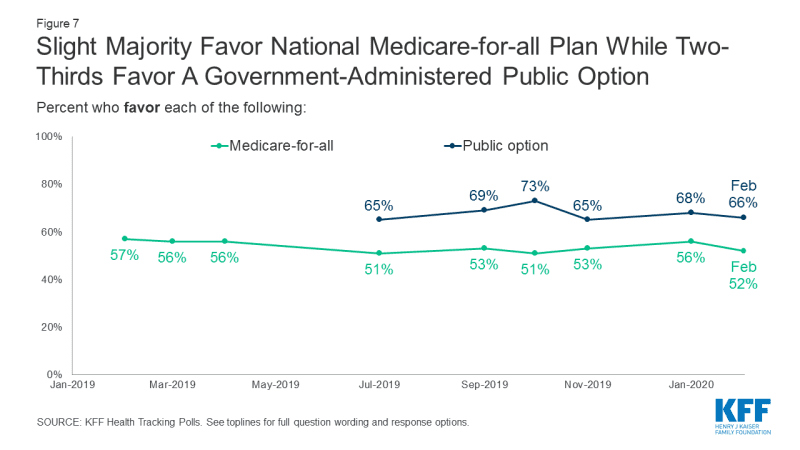 Part of the 2020 Democratic presidential campaign includes major health policy stories detailing the divide between the top candidates on proposals to expand the public health insurance program in this country. Tracking by KFF covered both a national health plan or a Medicare-for-All and depict incremental changes to healthcare plans to include a government-administered health plan or a government-administered Public Option. Depicted in the graph to the left, fifty-two percent of the public favor a Medicare-for-All plan in which all Americans would get their insurance from a single government plan. A greater percentage or 66% favor a Public Option that would compete with private health plans and be available to all Americans. Both would be government-administered.
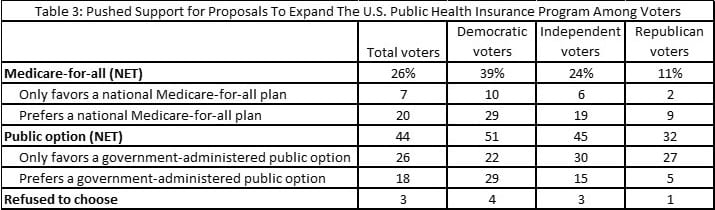 While a government-administered Public Option has the edge (44%) over a government-administered Medicare-for-All plan among Democratic voters, independent voters, and Republican voters; a significant share of Democratic voters (39%) either-only favor or prefer a national government-administered Medicare-for-All plan.
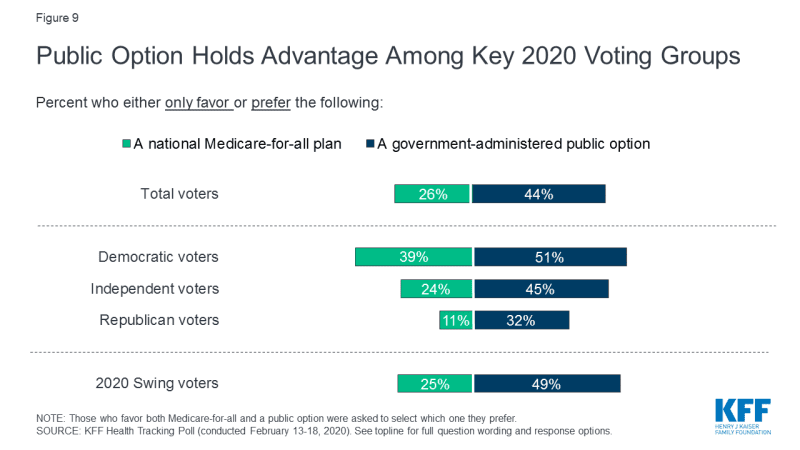 A government-administered Public Option also holds the advantage over a national government-administered Medicare-for-All plan among Democratic voters (51% v. 39%), independent voters (45% v. 24%), and swing voters (49% v. 25%). I believe Medicare-for-All is on the horizon and will be achieved in incremental steps. Rather than aggravate those who wish to keep their employer sponsored commercial healthcare plans in an attempt to force Medicare -for- All and lose a much – needed election win, the deeply political move would be to take on a government administrated Public Option plan using Medicare and VA pricing and allow time to take its toll on commercial healthcare insurance. Over time, the move can be made to a Single Payer healthcare plan which WILL cut costs if not left to ACOs (which Bernie’s plan uses) and big business.
KFF Health Tracking Poll – February 2020: Health Care in the 2020 Election, KFF, Ashley Kirzinger, Audrey Kearney, Mollyann Brodie, February 21, 2019
No one should care what Rep voters think about the ACA. A black guy made it happen, so it has to be evil.
“Kentuckians only hate Obamacare if you call it Obamacare,” Vox, Sarah Kliff May 12, 2014
“Kentucky is home to the Kynect, one of the state marketplaces that has done the best job at signing people up for health insurance coverage. And a new poll shows that the Kynect — while much less known than Obamacare — tends to elicit a much less negative reaction than the larger health care law.
Fifty-seven percent of Kentucky registered voters told NBC pollsters that they had an unfavorable view of Obamacare. Fewer than half that number — 22 percent — said they had an unfavorable view of the Kynect.”
“Kentuckians only hate Obamacare if you call it Obamacare“
I second this: “I believe Medicare-for-All is on the horizon and will be achieved in incremental steps. Rather than aggravate those who wish to keep their employer sponsored commercial healthcare plans in an attempt to force Medicare -for- All and lose a much – needed election win, the deeply political move would be to take on a government administrated Public Option plan using Medicare and VA pricing and allow time to take its toll on commercial healthcare insurance. Over time, the move can be made to a Single Payer healthcare plan which WILL cut costs if not left to ACOs (which Bernie’s plan uses) and big business.”
The only thing I’m not sure about is the role of ACOs in a Medicare for All / VA type system. I don’t disagree, I just haven’t thought about.
EMichael: the fact that Republicans hate the ACA if you call it Obamacare matters politically because Republicans will call it Obamacare at every opportunity!
Hi Eric:
I assume you read my email about your article appearing “elsewhere?”
ACOs incur a large amount of administrative cost as they bill the many commercial healthcare insurers and Medicare/Medicaid for that matter. Single Payer is exactly that, The Gov. pays the bills, sets the budgets for each hospital etc., sets doctor fees, and sets the prices (costs) for pharma, healthcare supplies, etc. Single payer is just that, one payer and no insurance company is allowed to duplicate what it offers for healthcare. The CBO stated ACOs would not save money and our experience to date is their actions of consolidation the market has led to higher pricing which was documented in a Health Affairs study revealing a 42% increase in in patient care and a 25% increase in out patient care of which 60% is due solely to pricing.
While there may be a tax increase, it will probably not be any greater than what a person pays for less effective commercial healthcare today. Warren and Sanders talking tax increases was a “yuge” mistake. They should have talked up cutting costs, eliminating “balance billing,” providing better healthcare, making it accessible to all US citizens, etc.
I did not imply using ACOs for the VA or Medicare. I did imply we should access the VA/Medicare pricing for commercial Healthcare insurance. The VA does better than Medicare for meds such as insulin. I have another piece coming out which will explain it better.
Eric,
It matters politically because every Republican voter will be against any Democratic plan, even those they actually like. The black guy just made it more obvious.
Hi EM:
I think you got it right, Barack Obama should have never allowed his name to be tied to and in place of the PPACA. I do not believe he foresaw the amount or racism in many people; the amount of destruction Republicans would wreak on the PPACA in eliminating CSRs, stopping Risk Corridor program which is used today and continuously for Part D, healthcare exchanges enrollment, etc.; and outright lies to the public and deliberate misinterpretation of what he said.
What I tried to depict in those 5 charts is the support is not there yet for Single Payer; although, it appears to be growing. We should hold fast on it for now and go for the Public Option with specific rules laid down so the commercial healthcare insurance companies and healthcare can not take advantage of it.
Run,
We agree.
EM
My next post will show how we can get part way there.
The Democrats are screwed this election anyway. I think they thought the Trump debt bubble would have burst by now, but the fact is, it is now just beginning to burst with huge default rates and surging interest rates as subprime commercial banks grapple with past errors. The lowering of lending standards via Trump is easily seen through the prism of his administration and the surge in defaults. This chimes with the corporate debt levels as they tend to borrow when consumer debt is growing(watch the surge in corporate debt in 2007 which stopped a recession that year, but it was just lagging the cycle and crashed in 2008).
I think health care reform is dead for the next several years. The Democratic electorate is out of sync with the rest of the country and it will be that way until the debt bubble bursts. It explains why DNC donors simply are starving Joe Biden, gave way to much money to a green homosexual with no chance in hell, why Bloomberg was able to jump the cycle where the DNC donors left. Why Bernie Sanders is loaded with foreign money.
The 2020 election is really not what you see now, but what you see in September.
BS,
Yes, that post surely is. Lies combined with ignorance(Really? Homosexual?) and of course your usual writing skills(sic) .