December JOLTS report continues the trend of confusing jobs data
December JOLTS report continues the trend of confusing jobs data
The December JOLTS report came out this morning, and it continues the streak of confusing employment data.
To recapitulate, the JOLTS report decomposes the jobs numbers into openings, hires, quits, layoffs and discharges, and total separations. Since the series is only 20 years old, however, it only covers one full business cycle, so is of limited forecasting use.
The order in which the JOLTS series peaked during the 2000s expansion was as follows:
- Hires peaked first, from December 2004 through September 2005
- Quits peaked next, in September 2005
- Layoffs and Discharges peaked next, from October 2005 through September 2006
- Openings peaked last, in April 2007
I’ll treat these in that order, below.
So to start, here are YoY hires (blue, left scale) and quits (turquoise, right scale) for the entirety of the series:<
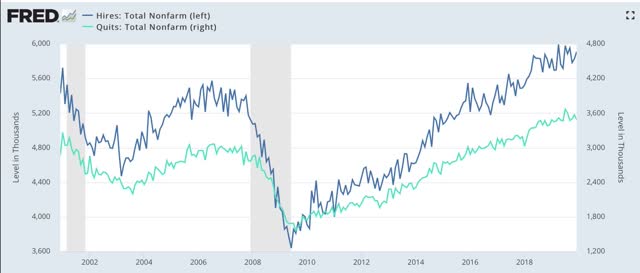
For the last nine months, hires have formed what in the stock market would be called a “pennant” pattern of lower highs and higher lows, i.e., the range is compressing and could break out in either direction.
Here’s the same data measured YoY:
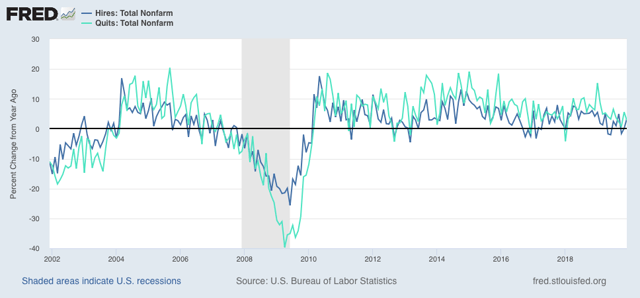
There’s clear deceleration, but have hires turned decisively negative? Impossible to tell.
Next, as I have often said, hiring leads firing (actually, total separations). Here’s what that looks like for the entire series:
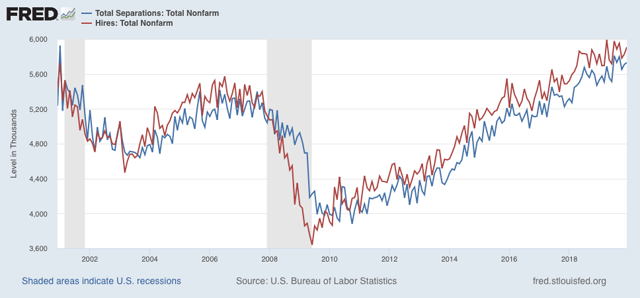
>Separations still appear to be trending up, but may also be forming a “pennant” pattern.
Next, here are layoffs and discharges (blue, left scale), which I am comparing against the monthly average of initial jobless claims (red, right scale):
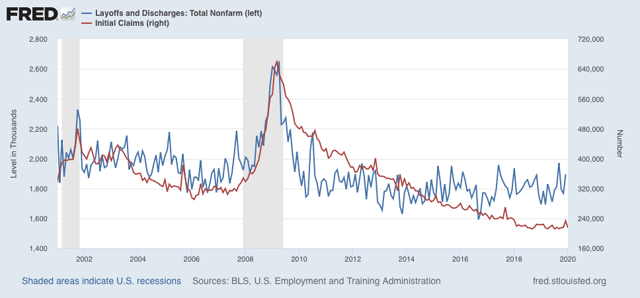
Layoffs and discharges have been trending higher for the past year. But the series is very noisy compared with initial jobless claims, which measures a very similar thing.
Finally, here are job openings, measured absolutely (blue, right scale) and YoY (red, left scale):
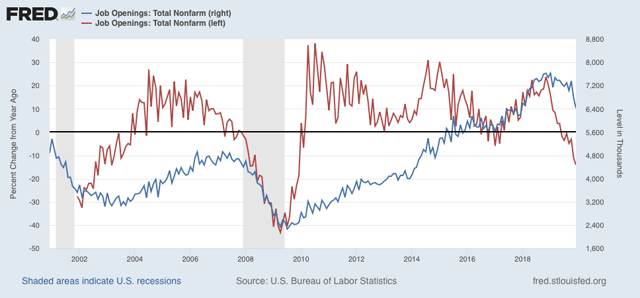
Openings are telling a terrible story. They are down 14% YoY. More significantly, they are down 15.8% from their November 2018 peak. This is equivalent to where they were off peak in May 2001 and March and April 2008 – early in recessions.
I am going to be consistent here: I have been downplaying job openings as a “soft” metric when they were booming, and there is no reason to treat them differently when they appear to be collapsing. But it is a very significant move for this series, so I cannot ignore it.
To sum up, in the order these series turned in the last business cycle:
- Hires have been flat for nearly a year, with an ambiguous trend
- Quits appear to be still rising, but may also be turning flat
- Layoffs and discharges have been trending higher, a negative
- Job openings have fallen off the proverbial cliff and are recessionary
In other words, the four metrics have turned neutral or negative in reverse order from their one and only previous cycle. It’s all very confusing. For now, my takeaway is a slowdown only.
Since the numbers aren’t adjusted for the working-age population, it’s hard to separate out what is driving the trend since the change in population drives a huge part of the economy.
When you look at hires divided by working-age you can see that population change has been driving much of the trend. If the drop in the latest quarter continues it may be a strong warning sign.
https://fred.stlouisfed.org/graph/?g=q9kG
Applying the same adjustment to job openings, they also look a lot more consistent with the latest drop especially worrisome.
https://fred.stlouisfed.org/graph/?g=q9kL