Scenes from the December jobs report: leading jobs sectors and wages
Scenes from the December jobs report: leading jobs sectors and wages
Let’s take a more detailed look at last Friday’s December jobs report.
First, as usual for the past few months, let’s look at the more leading jobs sectors. This month, let’s also take a more detailed look at wage growth and why it may have suddenly decelerated.
As an initial note, revisions going back to late 2017 are going to be available next month, and preliminarily it was already indicated that these will be strongly negative to the tune of several hundreds of thousands overall. In short, as weak as some of the numbers look now, they are likely to be even weaker when we see them next month.
Here is this month’s update to the three leading sectors of employment that I have been tracking: temporary help (blue in the graph below), manufacturing (gold), and residential construction (red). Here’s what they look like compared with 2018, showing the slowdown this year (remember that the GM strike is responsible for the big swings in manufacturing in October and November):
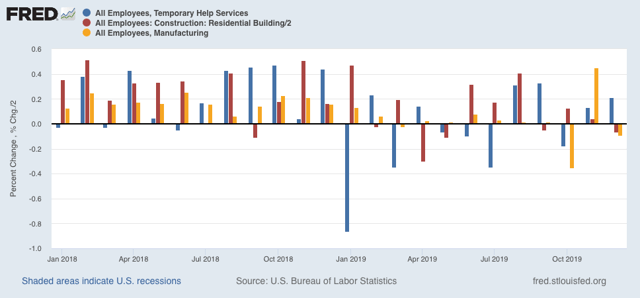
In November, residential construction had looked like it had rebounded from its losses earlier this year, more confirmation of the rebound in the long leading housing sector – but that was revised away this month!
Temporary help had seemed to defy the gloomy weekly statistics that have been worsening this year in the American Staffing Association report – except that, month after month for 12 months, there has been a consistent pattern of downward revisions. Below are the original number for the last six months on the left, followed by the first and then final revisions to the right:
JUL +2200 -7300* -10,500 (Net -12,700)
AUG +15,400 +14,500 +9500 (Net -5900)
SEP +10,200 +20,100 +9900 (Net -300)
OCT -8100 +3800 -5400 (Net +2700)
NOV +4800 +4000* (Net -800)
DEC +6400
*1st revision only
A similar pattern has emerged for manufacturing employment (initial and final numbers only):
APR +4. +3 (-1)
MAY +3 +2 (-1)
JUN +17 +10 (-7)
JUL +16 +4 (-12)
AUG +3 +2 (-1)
SEP -2 +2 (+4)
OCT -36 -45 (-9)
NOV +54 (+4)*
DEC -12
*1st revision only
Here are the same three sectors but measured YoY for the past 30+ years:
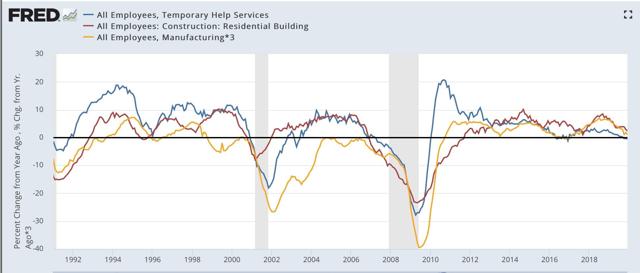
Note that all three turned negative months before either of the past two recessions (the manufacturing and residential construction jobs series existed before then; they were both negative YoY before the 1991 recession as well). Only temporary help is negative YoY right now.
Next, the average manufacturing workweek is now down a full 1.0 hour per week YoY from its peak. Although I only show data from 1983 onward below, going back 70 years there have only been 2 occasions where such a decline lasted longer than one month without a recession happening (1953 and 1966). In the modern era shown, only in 1985 and 1995 for one month apiece were there 1 hour declines without a recession following. A look at the YoY% change in manufacturing hours for the past 35 years also shows that such losses have *always* led to actual YoY losses in manufacturing jobs:
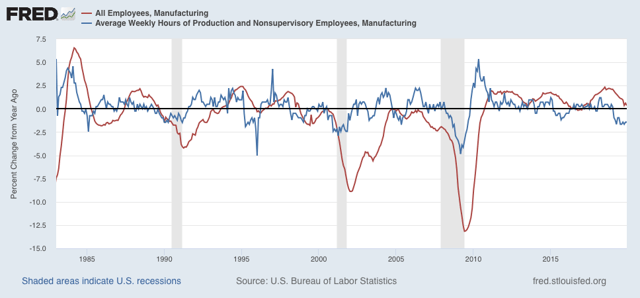
In short, in 2019, manufacturing only added 46,000 jobs, or less than +0.4%, and we should expect more and significant actual losses in manufacturing jobs going forward.
More broadly, only 176,000 jobs were added in the entire goods-producing sector all year (and 80,000 of those were in last January):
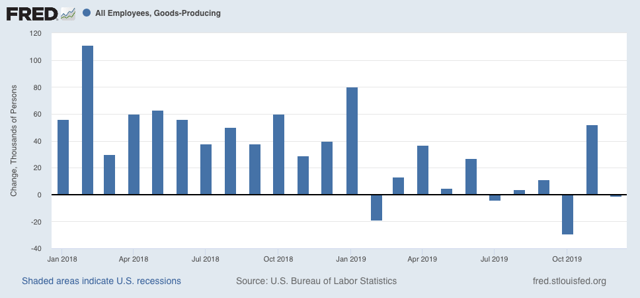
There were YoY losses in goods-producing jobs before all of the past 3 recessions, and going back 70 years, counting 12 recessions, in all but 3 there has been steep deceleration before and actual losses no later than two months into the recession, with only 2 false positives (1966 and 1985). Thus the current situation is consistent with at very least a severe slowdown.
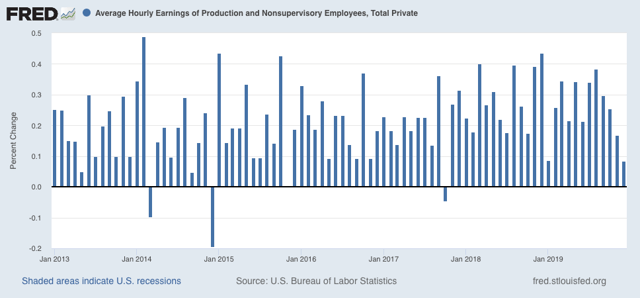
Now let’s turn to wages. December’s nominal growth of +$.02 per hour, or less than +0.1%, was one of the weakest readings in the past 7 years:
As a result, nominal YoY wage growth for non-managerial workers declined sharply to +3.0% from a peak of +3.6% only two months ago:
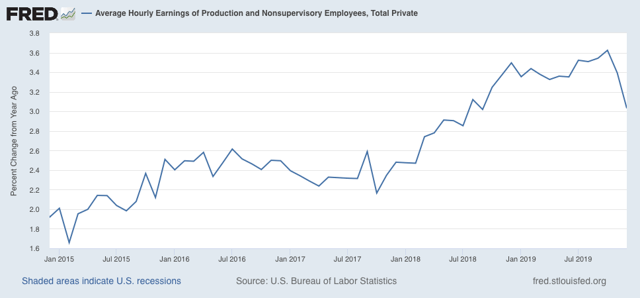
This has already received a lot of attention since Friday, but let me call your attention to two points. The first is that, as you can see from the first graph above, there is something of an anomaly in that not only did December replace an exceptionally strong reading from December 2018, but January 2019’s wage gains were also very week. In other words, if we get a decent number next month, the YoY% change will rebound significantly.
Secondly, there seems to be something of an inverse relationship in the short term (I.e., over a year or less) between big gains/declines in labor force participation and wage growth. Here’s what the two look like, averaged quarterly to cut down on noise, for the past 35 years:
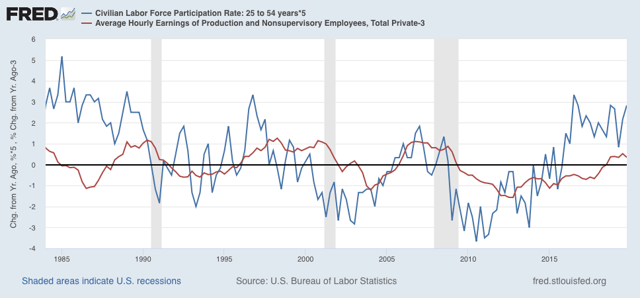
While *cyclically* the two move in the same direction, with a significant lag between participation and wage growth (wage growth being a long lagging economic indicator), over the shorter term we can see where a big decline in participation coincides with or precedes with a few month delay a stabilization in wage growth, while a big increase in participation coincides with or precedes with a few month delay a halt or decline in wage growth. It’s possible this is due to the mix of jobs being different, if lower-paying jobs grow more than other job categories. It may also be that the increased competition for jobs due to more participants acts to suppress wage growth.
In any event, we had a surge in participation in the latter part of last year, and so it is not a big surprise that there would at least be a pause in wage growth.