US Firearm Related Mortality
New analysis of 1999-2017 firearm deaths looks at changes in each state and within age, gender and racial/ethnic groups
Nationally, firearm-related mortality rates increased in period 2015–2017 after remaining relatively stable in period 1999–2014. Firearm mortality increases can be seen in “most” states and the demographics to the mortality seen in varying degrees. The increases suggest a worsening epidemic of firearm mortality geographically and demographically abroad. In both time periods, the fractions of firearm deaths due to suicide and homicide remained consistent.
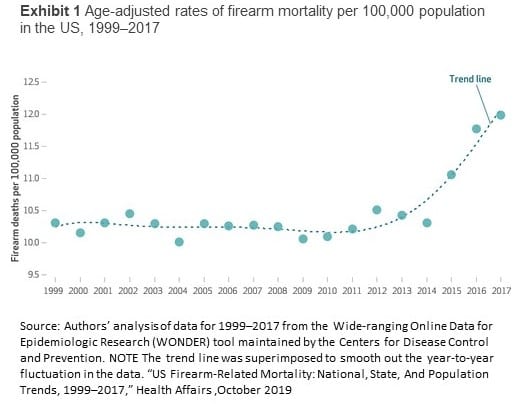 In order of magnitude, the rates of homicides, suicides, and unintentional deaths incurred in the United States are 25.2, 8.0, and 6.2 times higher than rates occurring in other developed countries. While remaining relatively stable from 1999 to 2014, the age-adjusted firearm mortality rates in the US increased for three consecutive years starting in 2015 as shown in Exhibit 1. One has to wonder why this could be.
Click on the image to enlarge.
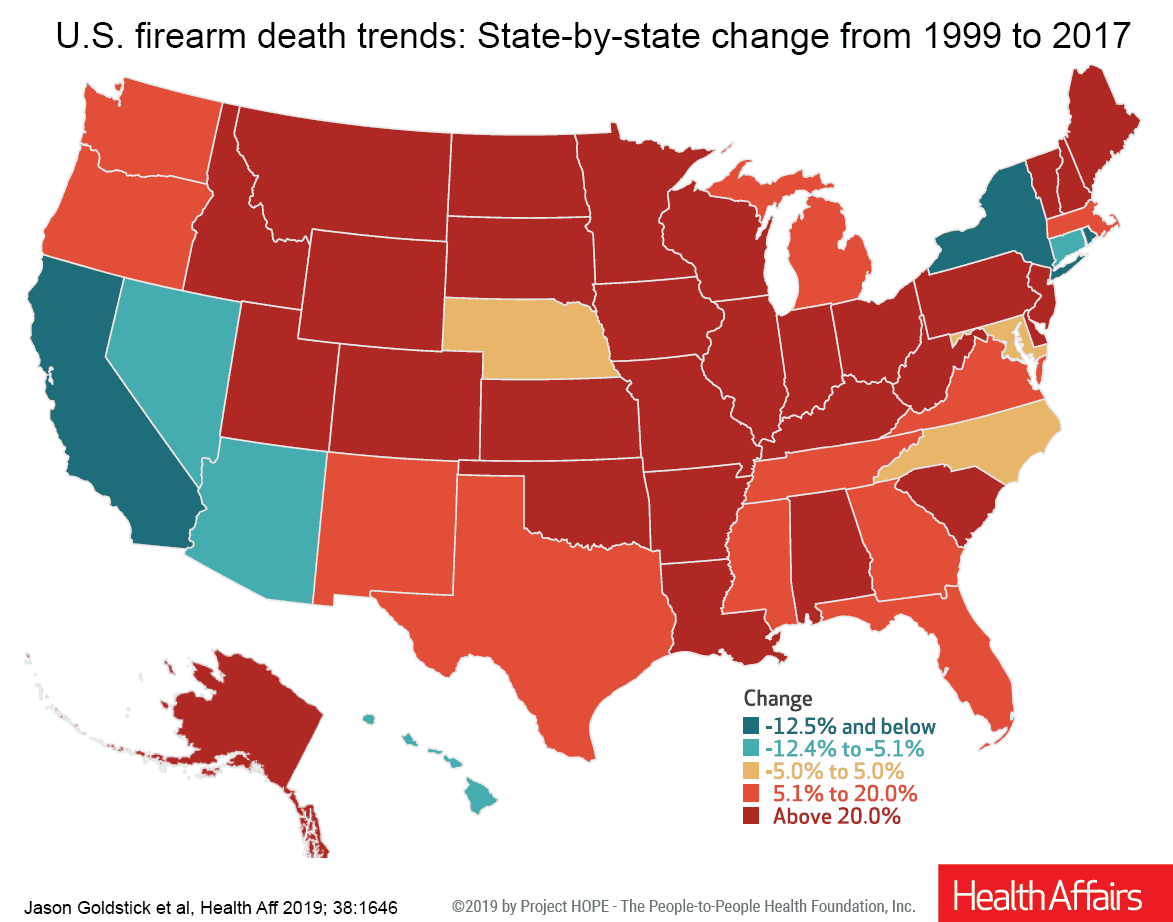 The increases are also apparent across the nations demographics (race, sex, age), mechanisms of death (suicide, homicide, etc.), and are broken down by states across the nation which I will not be showing today. Well beyond a majority, the states saw increases and a few have experienced decreases. The Health Affairs study “US Firearm-Related Mortality: National, State, And Population Trends, 1999–2017,” is the first to define the mortality of deaths by state. The Health Affairs state detail is too massive to display here and the study is only open to subscribers. I believe the more important part of this study is the upturn in the death rate starting in 2015. One can only speculate what has brought on the increase.
After the leap, Methodology, Limitations, and Conclusions
Methodology: The CDC WONDER mortality database and the International Statistical Classification of Diseases and Related Health Problems, Tenth Revision (ICD-10), codes (W32–W34, X72–74, X93–95, Y22–Y24, Y35.0, and U01.4); firearm-specific mortality rates for each state including the District of Columbia were collected for each year in the period 1999–2017. Subsequent queries extracted the mechanisms of suicide-specific, homicide-specific, and unintentional firearm deaths numerics for each code. Overall firearm mortality rates by sex (male or female), race/ethnicity (black or African American, non-Hispanic white, Hispanic white, Asian/Pacific Islander, and American Indian/Alaska Native), and age group (ages less than 1, 1–4, 5–14, up to 75–84 and 85 or more). The Hispanic ethnicity was not analyzed among nonwhite races because of high suppression rates (counts below ten are suppressed in all CDC WONDER queries. All rates (except age-specific rates) were age adjusted using data from the 2000 census. All mortality rates are expressed per 100,000 person-years.
State and subpopulation-specific changes in firearm mortality rates in the period 1999–2014 were compared to those in period 2015–2017. The study calculates those rates across states and subpopulations in periods 1999–2014 and 2015–17 and percentage changes between the two time periods. The analysis was also done for overall firearm mortality, firearm suicide, and firearm homicide.
Limitations: The analysis was limited by the suppression of rates “in lower-population areas and among smaller subpopulations (see footnote 1).” This may limit the generalizability of the results; however, the risks that affect the greatest numbers of people were able to be characterized. The analysis did not consider nonfatal firearm injuries. The subpopulation-specific trend analysis relied on some interpolation to present the most complete picture possible. The thrust of the analysis was to focus on the recent increase in the 2015-17 mortality in comparison to period 2009 – 2017.
Briefly: In period 1999–2014 there were 497,627 firearm deaths or 10.4 per 100,000 person-years of which 291,623 (58.6 percent) were suicides and 191,531 (38.5 percent) were homicides. In period 2015–2017, there were 114,683 firearm deaths or 11.8 per 100,000 person-years which reflects a 13.8 percent increase from period 1999–2014 in “per 100,000 person-years.” Sixty percent or 68,810 were suicides and 37.9% or 43,483 were homicides. All of the non-suppressed rates together, 81.2 percent showed increased mortality in period 2015–17 in comparison to period 1999–2014. The percentage change differed across states, demographics, and mechanisms. Only California (88.2 percent), New York (87.5 percent, with one rate suppressed), and the District of Columbia (90.0 percent, with seven rates suppressed) saw mortality reductions in a majority of categories. The only “demographic” showing majority decreases in mortality were Hispanic whites (55.6 percent, with fifteen rates suppressed); the only mechanism was unintentional firearm deaths (78.3 percent, with twenty-eight rates suppressed). Across period 1999 -2017, some states had a decreased trajectory while the same states showed increases in period 2015 – 2017. The factors leading up to the increase in period 2015 – 2017 can not be identified (footnote 2).
The study does go further in its breakdown by state, demographics, and overall 1999 – 2017 trend (as compared to looking at two different time periods). In particular, there may be one event which triggered the beginning of the increase in 2015 after a plateau of firearm-related violence from 1999 to 2014.
References:
US Firearm-Related Mortality: National, State, And Population Trends, 1999–2017,” Health Affairs Jason E. Goldstick, April Zeoli, Christina Mair, and Rebecca M. Cunningham, October 2020
I happened upon the author’s study at University of Michigan and included the link for it below and a couple of footnotes.
“Study: U.S. firearm death rate rose sharply in recent years across most states & demographic groups,” Rebecca Cunningham, Jason E. Goldstick, April Zeoli, Christina Mair,
Footnote 1. To protect identities, CDC data were not available (or “suppressed”) when fewer than 10 people of a given characteristic group died from a firearm injury in a particular state in a year.
Footnote 2. The authors note that they can not tell from the data they used what factors led to the increase in firearm death rates in recent years, nor the decreases seen in certain groups and geographic areas. They do say that the consistent findings across so many states and demographic groups indicate that the rise from 2015 to 2017 was not due to random variation.