September JOLTS report: mixed with “hard” positives and a “soft” negative
September JOLTS report: mixed with “hard” positives and a “soft” negative
This morning’s JOLTS report for September was mixed, with a decline in job openings and an increase in layoffs, but advances in hiring and voluntary quits.
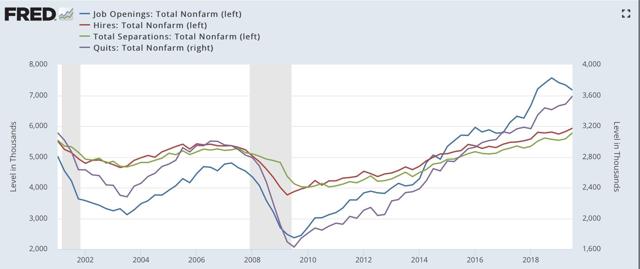
To review, because this series is only 20 years old, we only have one full business cycle to compare. During the 2000s expansion:
- Hires peaked first, from December 2004 through September 2005
- Quits peaked next, in September 2005
- Layoffs and Discharges peaked next, from October 2005 through September 2006
- Openings peaked last, in April 2007
as shown in the below graph(averaged quarterly through Q3):
Here is the monthly data for the past five years:
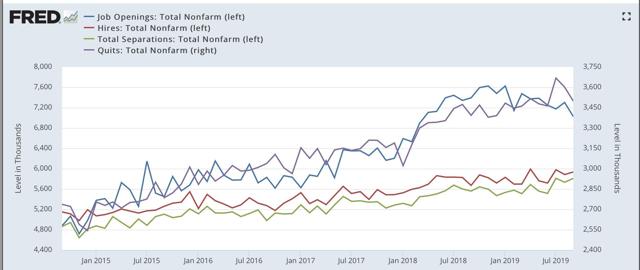
As you can see, hires and total separations are at or near their peaks. Quits have declined in the past two months from their all time high, but are still slightly higher YoY. On the other hand, job openings (which I consider “soft” data) have completely rolled over, and are actually negative YoY.
Next, here is the history of the “hiring leads firing” (actually, total separations) metric quarterly through Q3 of this year:
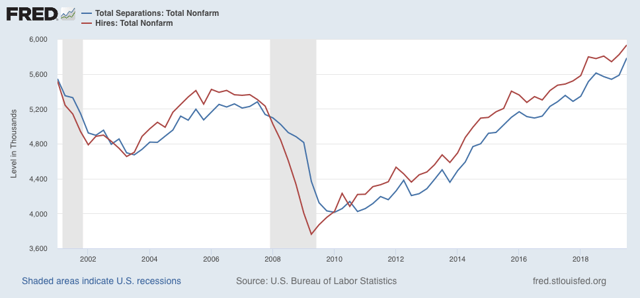
While both hires and fires essentially went sideways in late 2018 and through the first half of this year, in the third quarter, after revisions, both shot up to new highs.
Finally, For completeness’ sake, below are total layoffs and discharges. Note that these turned up appreciably in the six months or so before the Great Recession, with the quarterly average, shown in red, up 15% from its bottom – a similar level of increase that has historically been shown before recessions in YoY initial jobless claims during their lengthier history:
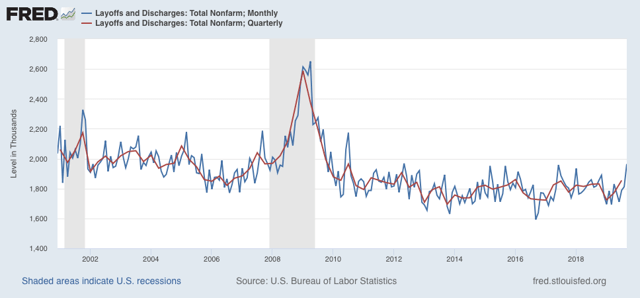
These did sharply increase in September, but the three month average hasn’t increased nearly enough to be a source of concern yet.
One month ago, the deceleration in nearly all metrics had reached neutral levels. With revisions, this month’s “hard” hiring and total separations metrics have resumed a positive trend, while quits are weakly positive, layoffs and discharges are neutral, and only the “soft” job openings metric is negative.
With only one complete previous business cycle to go on, it is difficult to form any judgment from these cross-currents.
I’m born in 1955. I retire next year. Could retirements be muddying the waters in total separations and hires? The baby boomer retirement boom must be pretty much underway by now.
reason:
It depends on what you are counting. Prime PR stops at 54 and then there is a separate group which includes 55 to 64. A third group and roughly, 40 percent (have to look again) of those 65 or older are still working and this is historically high. There are still a large number of people not working and looking and are counted as Unemployed and in the Civilian Labor Force. There are does who are not looking and are not counted in the Civilian Labor Force used to calculate U3 and can be found in Not In Labor Force. The latter (NILF) is much of your difference. Prime Participation Rate is also lower than previously.
Here is Josh Bivens talking about U3: The fuzzy line between “unemployed” and “not in the labor force” and what it means for job creation strategies and the Federal Reserve and this gives another perspective: Forget lower jobs growth, the number of people who’ve stopped looking for work is much more worrisome. I am retired at 70 and I am still pestered about working except they do not want healthy old white guys with greater knowledge. I am happy though.
The Boomer retirement boom started in 2007 based on the data. Its at its peak right now. 400000 per year vs. 100000 in 1999.
I figure the discouraged worker problem is due to the slowdown from 3% to 2% growth after 2000 and the withdrawal of the Boomer generation. Japanification of the data. This is why I think real full employment is 2-3% or 4% nominal wage growth in a neutral inflation environment. Japan’s U-3 is 2.4% just by chance and shows the same features the US economy does now.
Maybe this lesson will be that unemployment rates really don’t matter itself when compared historically, but potential unemployment to 4% nominal wage growth in a neutral inflation environment, which due to demographic and structural issues, changes.
I view the current economy a bit behind the 00’s era peak and noticeably behind the 90’s boom(which had a major – inflation pull in 98-99 yet still had higher wage inflation than today………..).
Reason, “retirements and deaths”, aka “other separations” are a separate category in this report that no one seems to track…they’re about 10% of separations, & as a percentage of the employed, they’ve been going down in recent years, baby boom retirements notwithstanding…
NDD says “layoffs and discharges are neutral” but i’m not so sure; i was somewhat startled to see layoffs were at a 89 month high…that, plus job openings at a 18 month low makes this a disturbing report…
to clarify, total separations were at 5,808,000 in September, retirements and deaths were at 346,000..
Seems to me increased layoffs, lower vacancies and increased hiring might mean that people were becoming available for hard to fill vacancies. That could signal a turning point.
reason:
Companies want ready-made candidates and no longer will spend and have not spent time in training people. Furthermore, they do not want to pay for experienced or trained candidates who can slip into a job readily. Much of the problem are the companies.