A note about turnout in yesterday’s elections
A note about turnout in yesterday’s elections
I haven’t seen any information yet on how turnout in last night’s elections, particularly in Virginia, which was an “off-off year” election, i.e., no statewide races at all, only state legislative and local races.
The state of Virginia keeps turnout statistics online back to 1976. The bottom line is, clearly something happened in the late 1990s that drove down turnout, which has been reversed in the last two years.
In the 5 “off years” with statewide races between 1977 and 1993, turnout averaged 61.6% of registered voters.
By contrast, turnout in the “off-off years” between 1979 and 1995, turnout averaged 54.6% of registered voters. That’s a 7% decline.
Now, here are the same figures for the 10 state elections thereafter.
In the 5 “off years” with statewide races between 1997 and 2013, turnout averaged 44.8%, a decline of almost 17%.
In the 5 “off-off years” between 1999 and 2015, turnout averaged 31.0%, a decline of over 23%!
Two years ago, 2017, was the first “off year” election after Trump’s win. Turnout was 47.6%, a bounce from the five previous “off year” elections but nowhere near the previous averages.
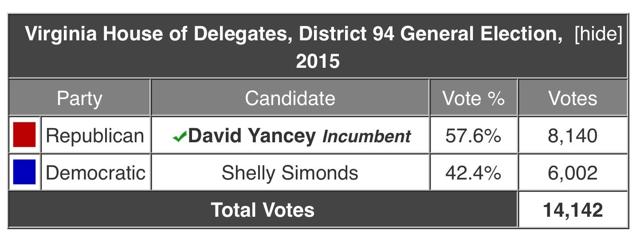
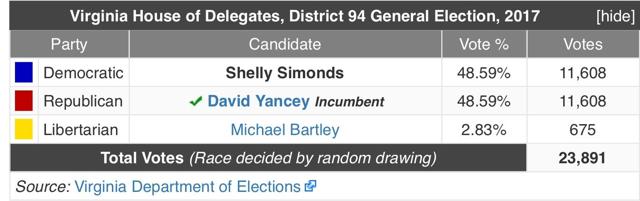
We don’t have information yet from yesterday, but here’s what happened in the House district that ended in an exact tie two years ago, that was won by a drawing from a hat by the GOP candidate, which gave the GOP a 51-49 majority (that’s right, exactly *ONE VOTE* made all the difference between which party was in control of the House of Delegates.):
2015:
2017 (the tie):
2019
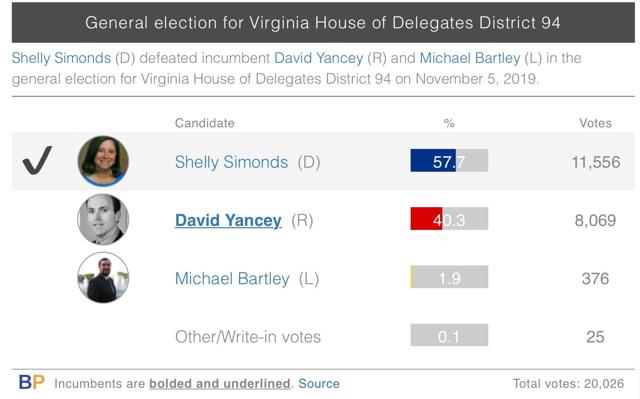
Turnout, at 20,000, was a lot closer to the 2017 “off year” 24,000 than the 2015 “off-off year” 14,000, probably about 39%. If that figure is representative of the statewide average, only a little less than half of the drop-off from the 1977-95 period will have been made up.
Big progress, but clearly still a long way to go.
UPDATE: This comes from Chaz Nuttycombe: median turnout in the Senate races was 41%, and for House of Delegates races was 40%, so pretty close to my estimate.
But the news in KY was great in these terms.
“Early estimates suggested turnout in Kentucky’s elections ― held in what’s called an off-off year, when neither congressional seats nor the presidency are at stake ― was extremely high, indicating an unusually engaged electorate heading into 2020′s presidential contest. Some 1.4 million people voted in Kentucky, according to NBC News, up about 400,000 from the last gubernatorial contest four years ago.
Democratic gains in the two states followed a similar pattern. The areas that swung hardest for Democrats were in the suburbs of major metropolises, where highly educated, generally upper-middle-class voters have been most dissatisfied with Trump’s performance. Beshear performed especially well in the suburbs to the south of Cincinnati, Ohio, for example. And although Trump had lost to Hillary Clinton in Jefferson County, which includes Louisville and its suburbs, by less than 14 percentage points in 2016, Beshear defeated Bevin there by over 35 points. Likewise, though Clinton’s margin in Fayette County, which includes Lexington and its suburbs, was less than 10 points, Beshear’s was over 32 points.”
https://www.huffpost.com/entry/kentucky-virginia-democrats-win_n_5dc243f6e4b0f5dcf8fd1d1f
My two theories are that something about the two parties available made them both equally unattractive to older voters, and/or one-party control made engagement pointless/unnecessary.
I don’t know if those states even have partisan local races though.