“House Democrats’ Drug Price Strategy versus a Cost Strategy”
The House Democrats just released their drug pricing plan (summary) on the 19th. I read through it rather quickly and I found it to be interesting and having targets which could work. Rather than jump right into this, let’s talk about purchasing a bit and then what I believe would be better.
In a purchasing negotiation there are two typical ways used to negotiate a price to your company. The first strategy is to tell a supplier you have done a market study, another supplier can offer a better price, and all things are equal between him and the other supplier. The supplier has a choice of beating the new price or offering something else of value to the customer which will negate the difference and can not be acquired from the other supplier (whip-sawing a supplier is unethical and many do it).
The second strategy requires more work and requires you to understand the cost of materials, the process and its cost, and the overhead involved. It does establish a base in which a buyer can use to negotiate with “all” suppliers. With the former strategy, you are guessing whether you have a good price because you do not know the cost of manufacture. Purchasing has to be a bit more than just a clerk.
The House plan intends to negotiate on pricing using other countries (Australia, Canada, France, Germany, Japan, and the United Kingdom) pricing to measure against for the same drug. The legislation establishes an upper limit for the price as no more than 1.2 times of the volume-weighted average of the price of the six countries reached in their negotiation. Australia, Japan, and United Kingdom use a cost-based method of pricing a drug.
Here is a brief explanation of the House plan:
Year 1 and each successive year, the Health and Human Services (HHS) secretary would identify up to 250 brand name drugs appearing to lack pricing competition and having the greatest cost to Medicare and the US healthcare system. The data would be collected from Medicare, Medicaid, and healthcare insurance to determine aggregate cost based upon price and volume of sales.
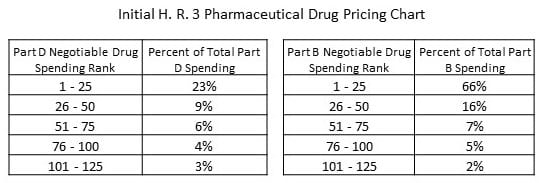 The total of 250 items picked with:
- the top 125 drugs in Medicare Part B responsible for a full 96% of Part B spending,
- and 125 drugs responsible for 45 percent of the spending in Part D.
As show in the chart. “More” to be read after the leap.
In the House’s wording, the HHS Secretary is to consider the drug’s research and development, production costs, alternative treatments, and the therapeutic value of the drug as compared to those treatments, and domestic and international sales information.
I am not sure who is arguing the next point whether it is Health Affairs or the House. The pricing index standards are not without precedent. Other countries (Canada, etc.) employ international reference pricing as an integral part of their strategy for negotiating prescription drug prices. Further, international reference pricing has been proposed here in the United States: the administration released a preliminary version of a proposal for reference pricing in Part B, and Senator Bernie Sanders (I-VT) and Representative Ro Khanna (D-CA) released a bill that would also use international prices in the Medicare negotiation context.
Dangers of Following Pricing
May 2019, JAMA released “Trends in Prices of Popular Brand-Name Prescription Drugs in the United States” study covering pricing trends 2012 – 2017 for brand name and generic drugs. Using the data of 35 million individuals taken from the Blue Cross Shield Axis (data base) for the time period of January 2012 through December 2017, researchers reviewed prescribed drugs exceeding $500 million in US sales or $1 billion in worldwide sales.
Within the identified parameters (above) of 2012-2017 sales, 132 brand-name prescription drugs were identified. Forty-nine of the 132 top-selling drugs exceeded 100, 000 pharmacy claims. Substantial cost increases (price to customer) among these drugs was experienced within the inclusion parameters with a 76% median cost increase, and 48 of the drugs had regular annual or biannual price increases.
Thirty-six of the 49 drugs were in the market place since 2012. Twenty-eight had experienced an increase in insurer and out-of-pocket costs exceeding 50% and 16 more than doubled in price. The remaining 5 drugs, insulins such as Novolog, Humalog, and Lantus and tumor necrosis factor inhibitors such as Humira and Enbrel experienced highly correlated price increases coinciding with some of the largest growth in drug costs.
The results of the study revealed the median sum of out-of-pocket and insurance costs paid by patients or insurers for common prescriptions and presented both annually and monthly. Pricing increases for 13 new drugs from January 2015 through December 2017) and entering the market in the last 3 to 6 years was no different than those (36) having been on the market longer, a 29% increase [median] from January 2015 through December 2017.
Nor did the study differentiate between drugs with or without a FDA approved therapeutic equivalent (number of drugs, 17 vs 32; median, 79% vs 73% price change).
Changes in prices paid were highly correlated with third-party estimates of changes in drug net prices (ρ = 0.55; P = 3.8 × 10⁻⁵), suggesting the current rebate system incentivizes high list prices and greater reliance on rebates resulting in increased overall costs.
“The study concludes the growth of drug spending in the United States associated with government-protected market exclusivity is likely to continue. Greater price transparency is warranted.”
Interpretation or a direction? Pharmaceutical companies; (including companies such as Mylan [EpiPens]) are using the patent drug laws (original and new and layered ones), the resulting exclusivity time period achieved, to maximize profit margins ($14.50 for every $1 invested [WHO]) and in protecting their products from competition. A similar exclusivity and result holds true for generic products also (time periods for the introduction for a similar generic product by a competitor [witness Mylan’s EpiPen vs Teva’s generic]). Can You Patent The Sun; (Jonas Salk)?”
My own thoughts on a House Plan – solution for a company refusing to negotiate on pricing to penalize them could backfire if a person in need of a particular drug can no longer obtain the drug due to pricing or market withdrawal. Who gets the blame, the company or the government?
In the end, how does one determine what is a fair price if no one has or knows the costs of manufacture? The granting of exclusivity through US patents and FDA regulations demanding a competitor’s generic must be used in the same manner as directed (patented drug instructions) as the patented drug should include the process and cost basis for each drug granted exclusivity in the US market.
Pricing should be determined from costs and manufacturing process and not from other prices.
A World Health Organization Study:
“Pricing of Cancer Medicines and Its Impacts” Geneva: World Health Organization; 2018. License: CC BY-NC-SA 3.0 IGO
The World Health Organization released this study on cancer drugs in 2018. It is a thorough report on how cancer pharmaceutical companies determine various strategies in markets for different drugs which may have to meet laws and pricing demands of each country. Within the market place cancer medicines is characterized by imperfect competition with three companies accounted for about 50% of the global market of cancer medicines as measured by 2017 sales value.
Discoveries (Executive Summary) :
Existing approaches to managing the prices of cancer medicines have not resulted in outcomes meeting policy and economic objectives. Stakeholders continue to voice concerns about the lack of access to both new and off-patent essential cancer medicines due to high prices cited as the main contributory factor. The overall prices of cancer medicines continue to rise to the extent of impairing the capacity of health care systems to provide affordable and population-wide access to cancer medicines.
Literature indicates a considerable proportion of targeted therapies approved in the past 15 to 20 years have data only for improvement for particular disease attributes such as a change in tumor size and lack evidence of a benefit in such as survival or quality of life. Some medicines having an impact on survival; the benefit may still be minimal small, with an average benefit of 3 months, and which may be considered as marginal by clinical experts.
Four broad determinants of medicine pricing used by much of industry perspective are the: (a) costs of R&D; (b) costs of production and commercialization; (c) “value” of the medicine to the patient and the healthcare system; and (d) sufficient income.
Including cancer medicines, estimates of R&D costs are highly variable and not transparent.
“Value-based pricing” has been proposed as a method of pricing new medicines. Associated with Value – based pricing are many uncertainties with estimating value, due to different technical approaches of assessment, incomplete evidence, comparison with inefficient practices, and different perceptions of value.
An analysis was undertaken to examine the sales incomes from cancer medicines approved by the United States FDA (1989 to 2017) for the originator companies. For the 99 medicines in the analysis, the average income return by end-2017 was found to be $14.50 (range: US$ 3.30 to US $55.10) for every $1 of R&D spending after adjustment for the probability of trial failure and opportunity costs. Thirty three of those medicines had already qualified as “blockbuster drugs” by having an average annual sales income exceeding $1 billion. Many medicines, and in particular biologics, continued to generate high sales incomes for the originator companies after expiration of patents and the end of exclusive marketing rights
The analysis suggests the costs of R&D and production may bear little or no relationship to how pharmaceutical companies set prices of cancer medicines. Pharmaceutical companies set prices according to commercial goals with a focus on extracting the maximum amount a buyer is willing to pay for a medicine. This pricing approach makes cancer medicines unaffordable and prevents the full benefit of the medicines
More Discussion
Pharmaceutical Industry Pricing Determination, Page 17; Noted are four determinants of medicine pricing: (1) costs of R&D; (2) costs of production and other expenditures relating to product commercialization; (3) value of medicine to patients, health care system and society; and (4) sufficient financial returns to incentivize future R&D programs .
Costs of R & D, Page 17: Prices of medicines (industry) must account for the R&D costs of the approved medicine, expenditures on investigating candidates for which marketing approvals did not eventuate, costs of failed attempts, and associated capital. Current prices (WHO) and profits from cancer medicines are at least sufficient to account for and if not in excess of the risks inherent in the R&D of cancer medicines. The returns are also sufficient for what would be necessary for the industry to maintain operation and continue to undertake R&D activities as evident in the high proportion of compounds in development for cancer
Cost of Production and goods, Page 18; Costs of production are operating expenses relating to product commercialization, including regulatory compliance, manufacturing, distribution, marketing and sales, and general administration. It is generally accepted, the marginal costs of production of medicines is relatively small when compared to their prices. A 2004 study found promotional activities in the USA accounted for 24.4% of the sales revenues (compared to 13.4% for R&D). Are such activities necessary for disseminating scientific information about medicines? Reducing the costs of marketing would translate into a reduction in the costs and by extension prices of medicine.
Determining the value of medicines, Page 20: In countries where there is a process for assessing, governments or authorized organizations consider the proposed price and costs of a medicine alongside scientific evidence demonstrating its health benefits and safety profiles which can be done through a comparison against the next-best available therapeutic option(s). Consideration points include the robustness of the process of determination, the availability of established evidence to ascertain clinical and economic value when reviewed for regulatory and reimbursement approvals, the appearance of high relative value of a medicine when compared against an inefficient current practice while the absolute magnitude of benefits of the medicine is low, and the conceptualization and measurement of value vary substantially because decision-makers (pharmaceutical companies and consumers) often value various attributes of medicine differently.
Achieving income expectation, Page 21; Instead of setting prices according to the value of medicines, pharmaceutical companies place more emphasis on setting prices according to their income expectations. As noted by an executive of a major multinational firm; the pricing of medicines is driven largely by the firm’s consideration of the cost of business, competition, patent status, anticipated volume, and most importantly an estimate of the income generated by sales.
Somewhat of a Summation
Looking at the pricing of a product will not give a buyer the information they need. Looking at the value provided by a product will not do so either. Looking at both without looking at costs resulting from a process be it manufacturing, marketing, or otherwise still fails the needs of a buyer and inhibits their ability to judge what is a good, fair, etc. price.

The WHO study reveals for every $1 invested in R & D, the average return is 14.5 times whether it be for this one drug or meant to cover failures in experiments to get to this drug and sometimes a history of failures of unrelated drugs. The JAMA study reveals over the period 2012 – 2017 price increases for 49 prescribed drugs exceeding $500 million in US sales or $1 billion in worldwide sales. Both studies appear to be using pricing and costs interchangeably and it makes a difference.
Thirty-six of the 49 drugs were in the market since 2012. Twenty-eight had experienced an increase in insurer and out-of-pocket costs exceeding 50% and 16 more than doubled in price. Insulins such as Novolog, Humalog, and Lantus and tumor necrosis factor inhibitors such as Humira and Enbrel experienced highly correlated price increases (between themselves) coinciding with some of the largest growth in drug costs. Thirteen of the 49 drugs entered the market later than 2012 had pricing increases no different than those (36) having been on the market longer . . . a 29% increase [median] from January 2015 through December 2017. Why and what is backing up these increases?
In Switzerland, drug prices are negotiated and validated at the Federal Office of Public Health (FOPH). The FOPH uses two criteria to determine the price: a price estimate based on a group of nine European countries and a comparison to prices of other drugs used to treat the disease. But for many cancer drugs like Herceptin, there is no equivalent comparison.
So what options do health systems have? The lack of transparency on price setting puts payers such as the healthcare ministries in a vulnerable spot when negotiating prices with companies and some countries fear being locked out of the market for certain drugs.
Both Roche formulations Herceptin and Mabthera were examined for costs by public TV to develop the pie charts and the amounts which went to R & D, Manufacturing, and Distribution. Both drugs have an 80% or so margin above and beyond costs and do not include marketing. Comparison pricing (pricing taken from 9 countries) was used for the cancer drug Mabthera to set its prices which still ended up with a large margin beyond costs. Herceptin is a new drug and there was no equivalent to compare against.
As I said earlier, the House bill will use other countries pricing to compare their results against and set pricing even though the prices may not recognize a true cost base. Some countries use a cost base analysis and some do not use a cost based pricing analysis as reported in the WHO study.
While I have suggested using a cost based pricing methodology would be preferable, I also believe we have to start somewhere to get control of the rising and out of control costs of pharmaceuticals and revert back to a stringent analysis later using a period of exclusivity as the carrot.
“The median time to generate revenue to fully cover risk-adjusted R&D cost of $794 million was 3 years (range: 2 years; 5 years, n=73).”
Run75441 (Bill H)
This post is a solid jumping off point for a more carefull look at what might be done to make pricing more affordable for most of us. Thanks Bill.
Of course, you left out “what the market will bear”. That’s the heart of capitalism.
The Defense Department used a lot of “cost plus” contracts. They were not without their own form inflating costs, but could something like that be used for the first few years of a new drug? The manufacturer would have exclusivity, and unless it is for a very rare disease, the ability to make a reasonable profit. How much the plus is and how long you prorate the cost over being the big variables, of course.
Jane:
When I cost modeled parts, we would meet with the supplier and check our information back and forth. What ever was reasonable I would accept. I knew the process of manufacture and could walk through It with them. Our problem is we just accept what they tell us as the truth and gospel. Their pay back can be as small as 3 years. The last line of my post states such. Instead of price decreasing or remaining stable, it consistently goes up (Jama paper). Your comment is legitimate. I believe we need to get control of the costs and review them and challenge them while knowing the process.
No the heart of capitalism is easy money followed by tight money……rinse repeat. Sadly it has made a bunch of children. 30 something’s acting like 20 something’s, 40 something’s acting like 30 something’s. 50 something’s acting like 40 something’s………should I go on? The debt based expansion is disgusting and perverted. It has swindled in the sheep as decadent cows grazing from the field.
Under Socialism, there would be no more debt or taxes. Usury would be abolished and men/women would serve a year of hard work right after graduating high school. Women would be required to have 2 children by age 25. Most of the bar/eatery culture would die. The singular focus would creating a ecological and technological “tribe” that destroys all others. While they live in cosmo decadence and degeneration of the bourgeois, we would be traveling the stars, saving eco-systems and driving conserving our resources in case of a disaster. When the time comes and debt stops, the famines and degeneration will destroy capitalism much like 2008 was leading.
There are only two countries that allow advertising of prescription drugs to consumers – New Zealand and the USA. It should be illegal! (as it was before 1985).
Tom:
It is kind of interesting when you run across a drug which has been applied to you to cure your disorder for the time being. Advertising is something we should not be paying for and the marketing effort is a major cost for companies which they want to be reimbursed.