This morning retail sales for May were reported up +0.5%, and April was revised upward by a net +0.5% as well. Since consumer inflation increased by +0.4% over that two month period, real retail sales have risen +0.6% in the past two months. For the past two months I have noted that sales were still slightly below their peak last November, and YoY real sales remained in a downshift. This morning’s report helps those comparisons substantially, as YoY real retail sales are now up +1.4%.
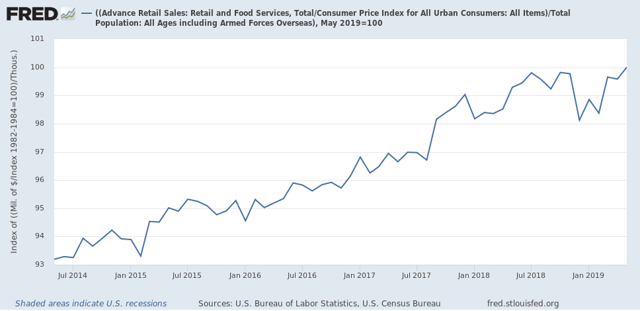
Here is what the last five years look like:
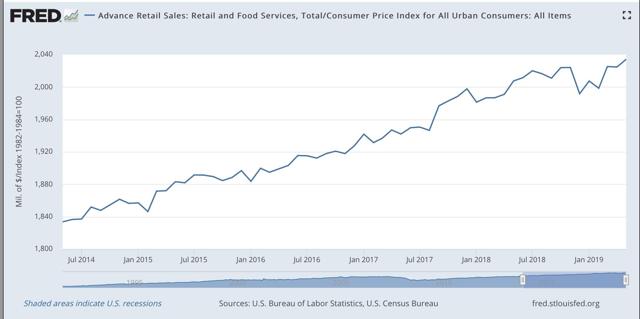
Real retail sales turned flat for about a year before both of the last two recessions. Even with this morning’s positive revisions, since late last year we’ve hit the biggest soft patch since 2013.
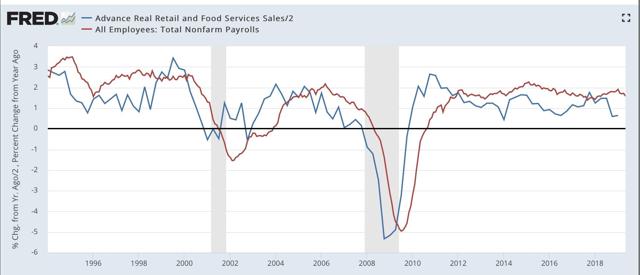
Next, although the relationship is noisy, because real retail sales measured YoY tend to lead employment (red in the graph below) by a number of months, here is that relationship for the past 25 years, measured quarterly to cut down on noise:
Now here is the monthly close-up of the last five years. You can see that it is much noisier, but helps us pick out the turning points:
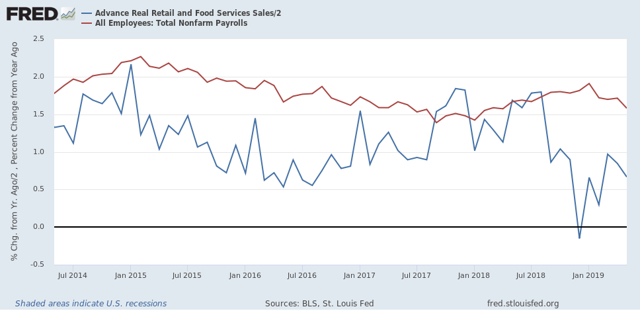
The lead times are somewhat variable, although usually within 6 to 9 months. We have had 9 months of a big downshift in YoY sales. Even with this morning’s improvements, the YoY metric is still low, and so I still expect the slowdown in employment as measured in the monthly jobs report that showed up last Friday to continue.
Finally, real retail sales per capita is a long leading indicator. In particular it has turned down a full year before either of the past two recessions:
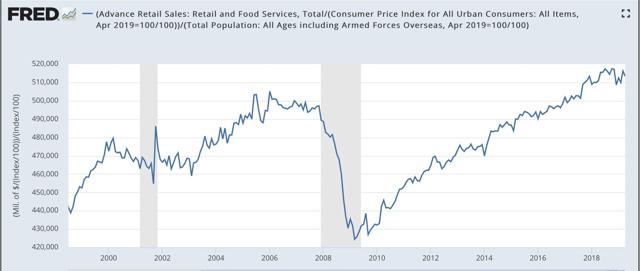
Here is the close-up of the past five years:
The good news is, as of this morning’s report this measure made a new high, which if not revised away is evidence against a recession this year. Further, in the last 70 years, this measure has always turned negative YoY at least shortly before a recession has begun. Although there have been some false positives, there are no false negatives. But this is still up a little over +0.6% YoY, which is very much consistent with a slowdown.
To sum up, real retail sales Have resumed a weakly positive trend, that nevertheless points to a slowdown in employment gains in the months ahead.
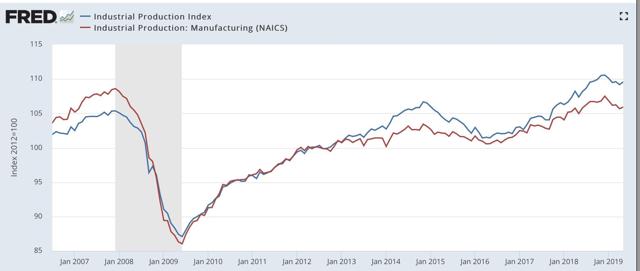
Turning to industrial production, this also improved, up +0.4% in May. The difference is, this merely took back the -0.4% decline in April. Industrial production, both in total and limited to manufacturing, is lower than it was last December:
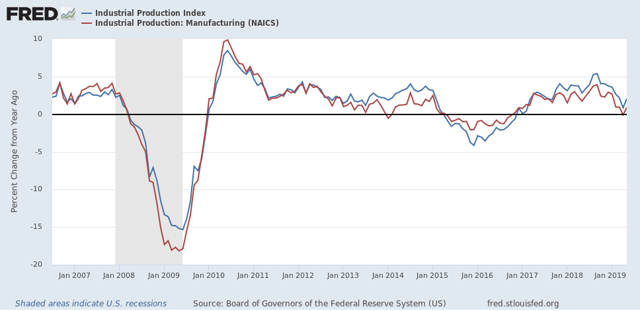
YoY industrial production is only up +2.0%, a mediocre result compared with most of this expansion:
Bottom line: the consumer part of the economy is picking up after the government shoutdown caused “mini-recession”. But the producer side is still *in* a shallow recession now. If the economic slowdown we are in is going to metastasize into a recession, it is probably going to come from the producer side and be due mainly to the effects of chaotic trade and tariff decisions from the Administration.
I know I sound like a nag. But as of April the y/y change in the CPI is 2.0% while the BEA deflator for retail sales is zero (0.0%).
So your deflating retail sales with the CPI means you are significantly understating the strength of consumer spending.
Because the CPI contains services it is almost always higher than the retail deflator.
Can’t anyone get the Fed of St. Louis to end its practice of deflating retail sales with the CPI.
In the CPI energy has a weight of 7.8% while energy now only accounts for 4% of TOTAL PCE.
I expect nominal retail sales to bounce between 2-4% for the rest of the year. I expect June/July to be weaker than last year, thus nominal sales down closer to 2%, then a uptrend in August/September raising the average back to 3%+, then another downtrend in October/November and a uptrend with that big December drop coming off. Then recession. I see nominal sales declining to 1% by the summer of 2020 and then 0% by the end of 2020 representing the crest and end of the recession.
The trigger is corporate debt decline, which imo starts in the 3rd quarter, triggered by BBB debt and its huge bubble collapsing. Auto markets are heavily driven by this debt and once it goes, so does their balance sheets, which are already bad. This will force production cuts for fiscal 2020 as they stop incentives to rebuild balance sheet.
Total BEA sales are lower though, making your point fairly irrelevant.
To further my point, BEA “retail” sales were flat in April and did rise in May. However based on revolving future credit, June/July are not going to be especially good months as we expect at this point.
following up on Spencer’s comment, i figured that real personal consumption of goods rose by around 0.6% in May, after rising by a revised 0.6% in April; in other words, double the rate of increase that NDD has for over two months….& i use CPI too, but i deflate core retail sales (ex food & energy) with the CPI’s composite price index of all goods less food and energy goods, then i deflate gas station sales with the CPI index for gasoline, deflate grocery store sales with the food at home price index, and then deflate restaurant & bar sales with the price index for food away from home, omitting the later from my PCE goods estimate…
deflating retail sales with the CPI means you’re deflating those sales with the rising costs of health care, tuition, and rent, illogical even if it happens to be close to right every now and then…
anyhow, the BEA will report real PCE on Friday of next week, and the actual change in real retail sales will be shown in Table 7 of their full pdf, if anyone wants to see who gets it right…