Trucking tops ailing rail (nerdy)
Trucking tops ailing rail (nerdy)
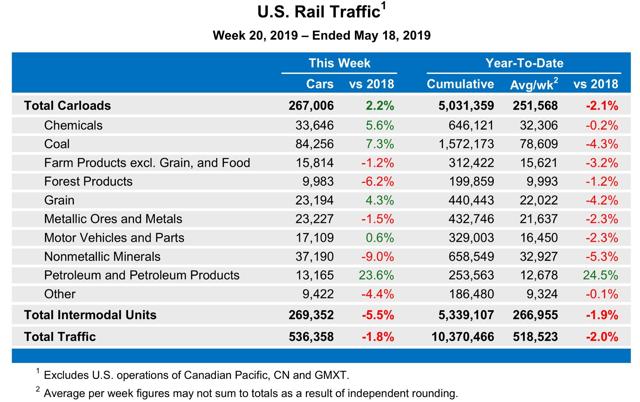
Since the beginning of this year, weekly rail volumes have usually been negative. The full year to date volumes have also been negative YoY:
Since all manufactured goods have to be transported to market, if this is something confirmed in other transportation readings, it would clearly be recessionary – as in, a recession has already started.
One alternative measure of the transportation sector is the Cass Freight Index.
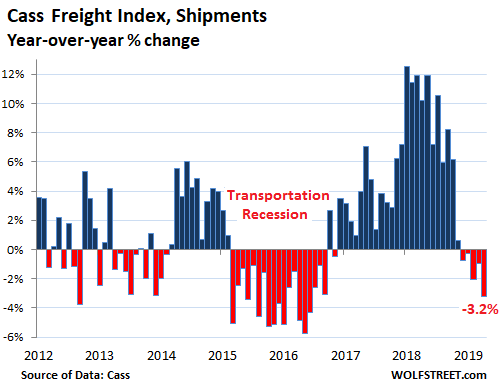
Although, interestingly, the primary reason for the downturn seems to be an anomalous surge that happened in late 2017 (due primarily to the hurricanes?) and went out of the YoY comparisons in late 2018, as shown in this next graph:
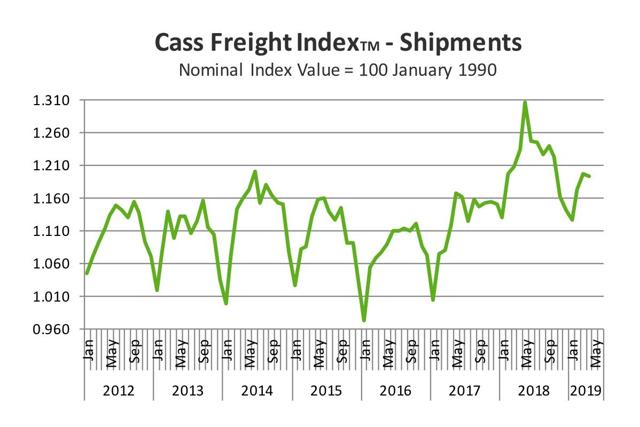
Note the seasonal downturn that typically starts to happen in about October, but never happened in 2017. As a result, on a 2 year basis, the Cass Index is up 7.0%.
Another issue with the Cass Index, however, is that it also measures international air and ocean shipping volumes for the U.S. So at least some of the downturn may be changes in international freight, perhaps due to Trump’s trade wars.
So I have been waiting for the April American Trucking Association Index. If domestic trucking is down as well as rail, that clearly looks recessionary. But if trucking is up while rail is down, that looks like a substitution, possibly due to competing costs, and/or possibly due to changed transportation patterns as western railroads suffer due to the widened Panama Canal increasing shipments directly to East and Gulf Coast ports.
And, late last week, the April trucking index was released.
Here’s what it shows:
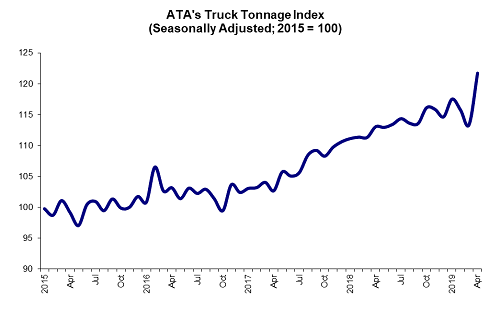
According to the ATA:
[the] seasonally adjusted (SA) For-Hire Truck Tonnage Index surged 7.4% in April after decreasing 2% in March. In April, the index equaled 121.8 (2015=100) compared with 113.4 in March.
“The surge in truck tonnage in April is obviously good for trucking, but it is important to examine it in the context of the broader economy,” said ATA Chief Economist Bob Costello. “February and March were particularly weak months, as evidenced by the 3.5% dip in tonnage due to weather and other factors, so some of the gain was a catch-up effect. In addition, the Easter holiday was later than usual, likely pushing freight that would ordinarily be moved in March into April.”
“I do not think the fundamentals underlying truck tonnage are as strong as April’s figure would indicate, but this may signal that any fears of a looming freight recession may have been overblown,” he said.
Even averaging April with March, however, the trucking index remains positive.
The bottom line is that the downturn in rail has not been confirmed by trucking, which continues in an uptrend. This is real time evidence that while the economy may be softening, it’s not in an outright downturn.
Is the enlargement of the Panama Canal so that large ships could go directly to and from the East Coast to Asia rather than trans-shipping from the West Coast impacting rail and truck traffic?
Its a lame index though. It doesn’t show recession until well underway.
Spencer:
I think it is, and it makes rational sense. But I haven’t been able to find good statistics on nationwide port volumes. To be fair, Steven Hansen of Global Economic Intersection thinks I am wrong, and posted a graph on national port traffic in support, but he did not disclose his source, and his graph is almost designed not to show small percentage changes.
Shifting trade from West Coast to East Coast should not impact total trade and the real Census data shows both real imports and export growth peaking in late 2018. But I would think it should strengthen short haul truck traffic at the expense of long haul rail traffic.
This made me think of this post from James Hamilton
http://econbrowser.com/archives/2018/08/measuring-global-economic-activity
Measuring global economic activity
Measuring the level of global economic activity is of key interest. But the measures we have on variables like industrial production don’t cover all countries and are only available with a significant lag. Michigan Professor Lutz Kilian suggested in an influential paper published in 2009 that we could get a useful timely indicator by looking at average shipping costs. I recently had a chance to look into the details of how that series is constructed and have some suggested improvements.
How is this Baltic Dry Index doing of late?
https://tradingeconomics.com/commodity/baltic
‘Baltic Dry decreased 200 or 15.60% since the beginning of 2019, according to trading on a contract for difference (CFD) that tracks the benchmark market for this commodity. Historically, Baltic Exchange Dry Index reached an all time high of 11793 in May of 2008.’
So this measure noted in the economic literature is also suggesting a recession may be on the horizon.
We are clearly in a growth recession right now. GDP guesses at this point, generally don’t do a good job. Q3 2007 it initially came in at 4.8%……….now 1.4%.
So growth is slowing, unlike 2015-16 which was triggered by the commodity bust, this looks structural.
Spencer: it’s the shift in port traffic from west to east that I can’t find good documentation about.
Pgl: the problem with cost metrics like the BDI is that they are also subject to changes in supply, not just demand. For example, is a downturn in shipping due to a deterioration in demand, or overbuilding of new ships?
I quit using the Baltic Dry index years ago and now use the CRB:Industrial Raw Material prices ndex as a proxy for world economic growth.It does not include energy commodities. It has been falling for the past year, suggesting very weak global growth. But it is not falling sharply as a global recession would imply.
Interestingly, coal production is down almost 25% from its September 2018 peak. Of course coal is a major user of rail, but not trucking.