March JOLTS report: Hiring and discharges show signs of late cycle deceleration
March JOLTS report: Hiring and discharges show signs of late cycle deceleration
The JOLTS report on labor is noteworthy and helpful because it breaks down the jobs market into a more granular look at hiring, firing, and voluntary quits. Its drawback is that the data only goes back less than 20 years, so from the point of view of looking at the economic cycle, it has to be taken with a large dose of salt.
With that disclaimer out of the way, today’s JOLTS report for March generally showed a slight backing off from their recent best readings of this expansion. All of the series are off their best levels, and three of the five noteworthy ones continued to decline:
- Quits declined slightly (less than -0.1%) and are -2% off their peak of two months ago.
- Hires declined slightly to about -4% off their October peak.
- Total separations rose declined to about -4% off their peak in last July.
- Job openings rose and are now down -2% from their November all time high, reversing February’s sharp decline.
- Layoffs and Discharges declined about -5% (a good thing) and remain about 7% above their September 2016 low, although well below their levels of most of the past 18 months.
Let’s update where the report might tell us we are in the cycle.
First, below is a graph of the *rates* of hiring, quits, layoffs, and openings as a percentage of the labor force since the inception of the series (layoffs and discharges are inverted at the 3% level, so that higher readings show fewer layoffs than normal, and lower readings show more):
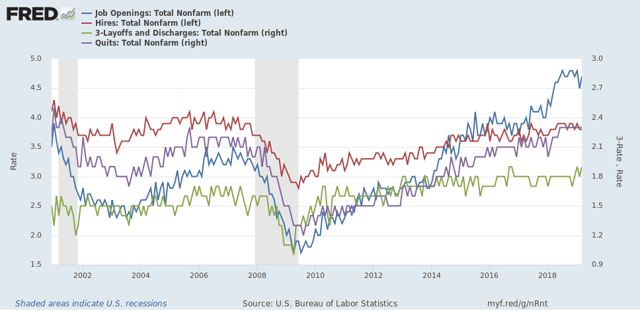
- Hires peaked first, from December 2004 through September 2005
- Quits peaked next, in September 2005
- Layoffs and Discharges peaked next, from October 2005 through September 2006
- Openings peaked last, in April 2007
As of this report, hires and openings *possibly* show signs of having made a cyclical peak at this point, with quits steady and layoffs and separations at their best level of the cycle.
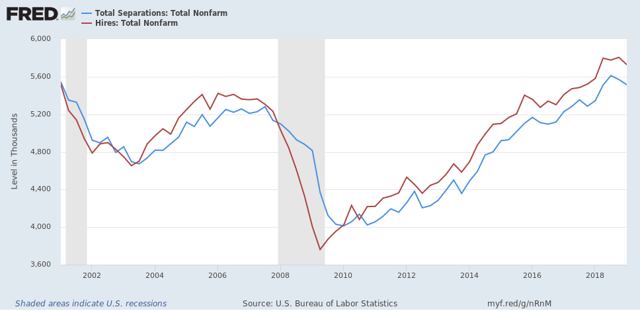
Next, here’s an upd ate to the simple metric of “hiring leads firing,” (actually, “total separations”). Here’s the long term relationship since 2000 through Q1 of 2019:
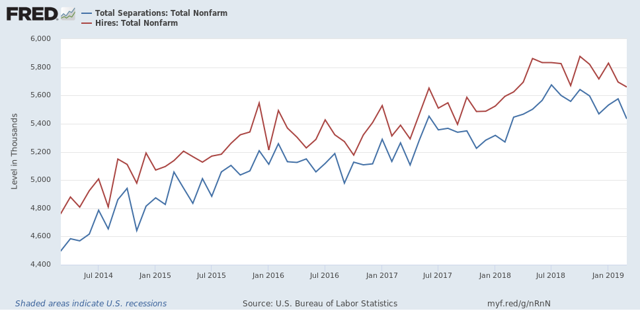
Here is the monthly update for the past three years:
In the 2000s business cycle, hiring and then firing both turned down well in advance of the recession. Importantly, both may have made their cyclical peak last summer in and autumn. If so, that would be sin line with what happened during the 2000s expansion, when hires peaked first, but it is obviously too soon to know for sure.
Last month I wrote there was deceleration but no sign of a significant downturn. This month there is, and total separations are now negative YoY:
Finally, let’s compare job openings with actual hires and quits. As you probably recall, I am not a fan of job openings as “hard data.” They can reflect trolling for resumes, and presumably reflect a desire to hire at the wage the employer prefers. In the below graph, the *rate* of each activity is normed to 100 at its July 2018 value:
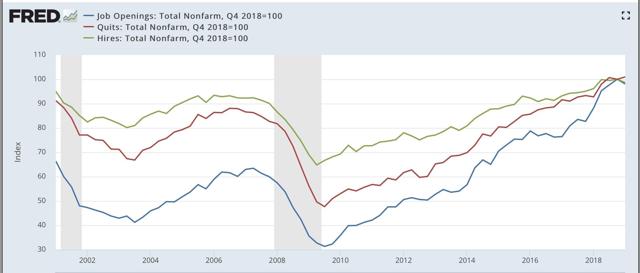
Now, here is a close-up of the last three years:
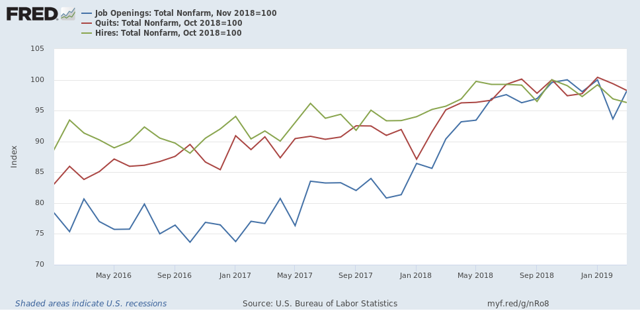
In 2018, my take was that employees have reacted to the employer taboo against raising wages by quitting at high rates to seek better jobs elsewhere. If the dam were finally breaking, we should see the hiring rate increase, and quit rate level off. That is not the case, as quits have continued to increase slightly, while hires have decreased slightly.
In summary, with the exception of the decline in layoffs and discharges, the March JOLTS report reflected some weakness. Further, if the pattern on the last cycle holds, then we may have begun to see the late cycle deceleration, in which case I will be watching to see if the quits rate begins to turn down as well.
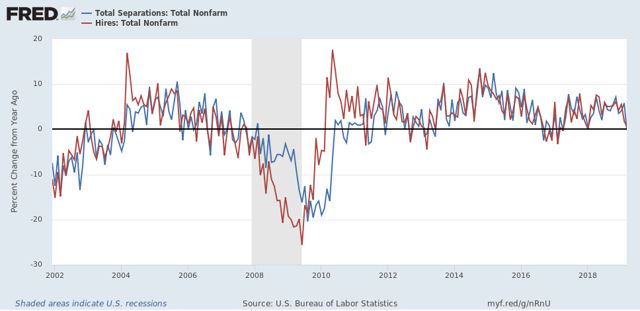
Looking carefully at the lead up to recent recessions and remembering that a recession is defined as two quarters of decline (i.e. the decline precedes the start of the recession), it looks to me like the labour market indicators are at best co-incident – and definitely not leading indicators. Rear vision mirror stuff as far as I’m concerned.