Two more leading sectors to watch for in tomorrow’s jobs report
Two more leading sectors to watch for in tomorrow’s jobs report
Yesterday I updated my look at temporary jobs, a known leading indicator for jobs overall. Today I want to look at two more leading sectors: manufacturing and construction.
Unlike temporary jobs, I’m not looking for a possible decline. Rather, I am looking for a deceleration in growth from their recent peaks. Let’s take them in order.
First, manufacturing. Because the ISM is picky about allowing FRED to publish their data, I have to do this in two separate graphs. So, the below two graphs are of the ISM manufacturing index and its new orders sub index, followed by the YoY% change in manufacturing employment:
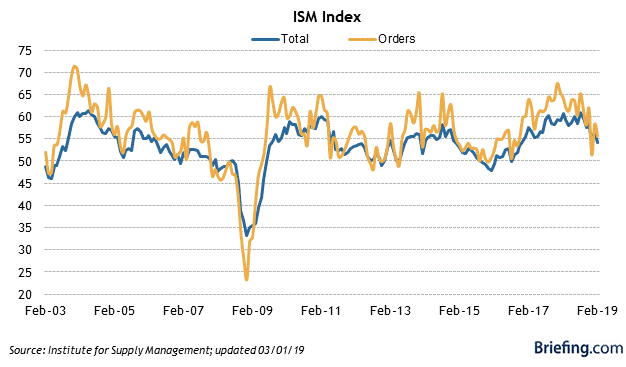
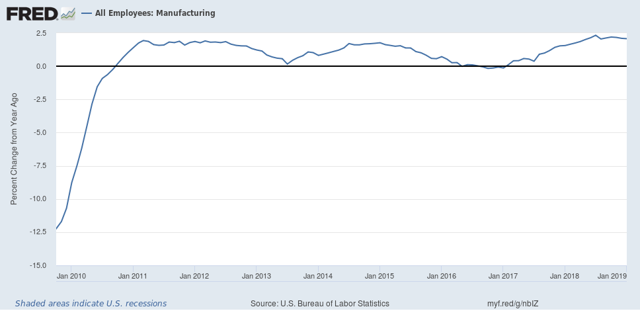
The important point of the two is that manufacturing jobs tend to follow the ISM index with a 6 to 12 month lag. Thus, for example, the ISM manufacturing index first went into contraction (a reading below 50) in October 2015. Manufacturing jobs didn’t contract YoY until March 2016. By June 2016 the ISM index had turned positive again. Manufacturing jobs didn’t get there YoY until February 2017.
In 2018, the ISM manufacturing index peaked in August. So I am expecting YoY growth in manufacturing jobs to decline. Since one year ago manufacturing added 30,000 jobs in February, I am expecting substantially fewer than that to be added tomorrow.
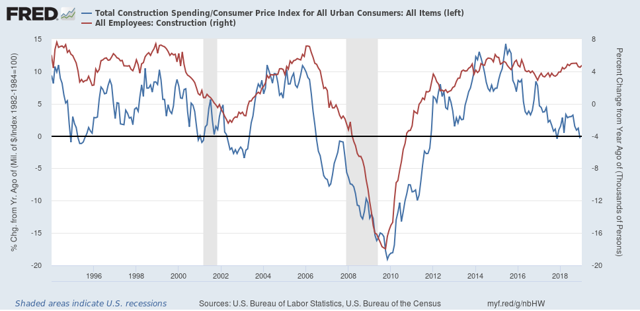
Second, construction. The first graph below compares the YoY% change in construction spending adjusted for inflation (blue) with construction jobs:
Although the former is somewhat noisy, it is pretty easy to see that usually construction jobs have followed spending by a few months — except in the last couple of years, and arguably during the first couple of years (2006-07) of the housing bust.
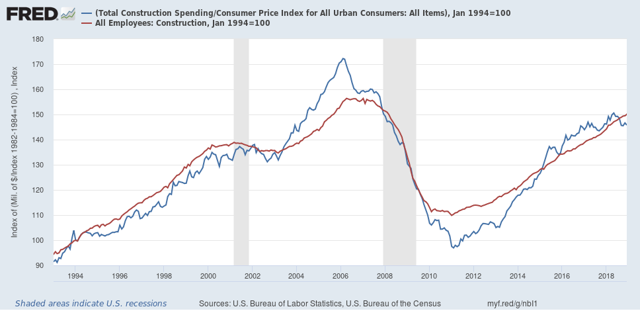
Looking at the absolute values of the same data series is helpful (note that both series have been normal to 100 as of January 1994):
Now we can see that the two grow or decline at nearly identical rates over the longer term, with jobs following spending with a short lag.
But the other thing that jumps out is how spending outpaced jobs growth (I.e., blue line above red line) during the housing boom, and again during 2015-17. This suggests that during those periods existing workers were getting more hours, rather than more workers being hired. When demand waned, first hours were cut before layoffs began. Since spending has only fallen back below jobs in the past half year, I’m not expecting a decline in construction jobs, but rather a leveling off in the YoY pace.
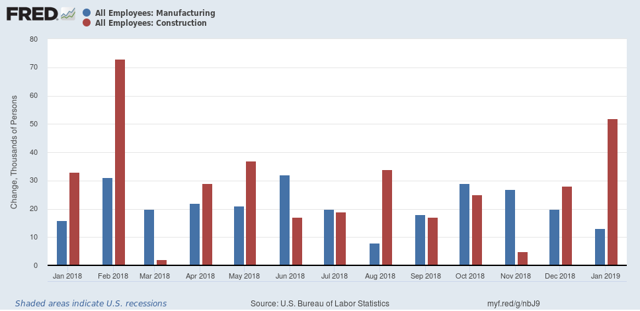
This can be summed up by looking at the monthly gains for the past year in manufacturing (blue) and construction (red):
Tomorrow I am looking for continued gains in both manufacturing and construction, but a cooling in manufacturing vs. continued trend growth to a slight deceleration in construction. In both cases this means gains of less than 30,000, and possibly as low as 5,000. Because the economy is slowing, and this should show up in jobs numbers, if there is a surprise in either or both, it will likely be to the downside.
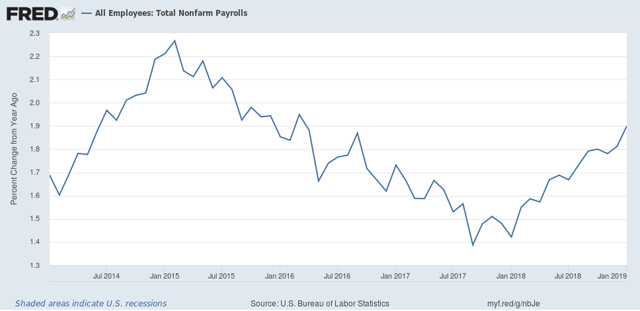
Finally, I expect YoY overall jobs growth to begin to decelerate from its peak last month:
which means a gain of fewer than 200,000:
We’ll see tomorrow.

Job growth as measured by the household survey tends to lead job growth as reported by the payroll data.
I suspect this is because the household survey does a better job of measuring jobs in small firms and start-ups and those businesses react faster to changed conditions because decisions to hire/fire do not have to go through several layers of bureaucracy.