A little over a year ago, I proposed A simple model of interest rates and the jobs market. As I explained at the time, “during the past such era of [low interest rates in] 1930-1955 several recessions including the very bad 1938 recession occurred without a yield curve inversion, I have been looking at alternative measures.”
What I found was that “a YoY increase in the Fed funds rate equal to the YoY% change in job growth has in the past almost infallibly been correlated with a recession within roughly 12 months.”
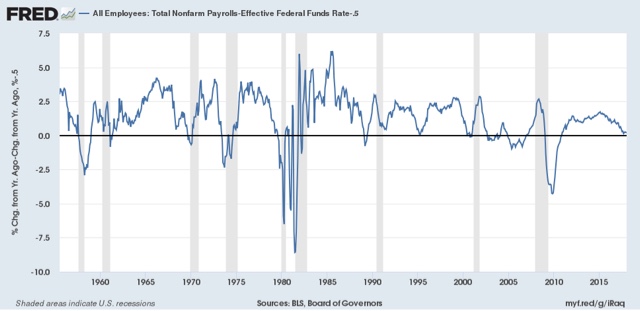
Here’s the graph I posted of “the relationship I describe in the above paragraph over the last 60+ years:”
Another graph “subtract[ed] the YoY change in the Fed funds rate from YoY payroll growth, and subtracts a further -0.5%, showing that even when the relationship gets that close, with the exception of 2002-03 (a near recession), a recession has always followed:”
“In other words, there is only one false positive with two false negatives in the 1950s.”
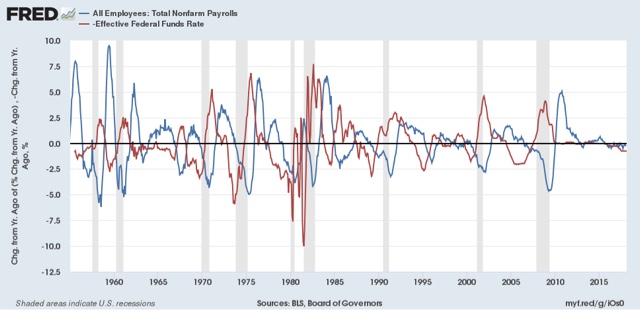
I further wrote that “because the YoY change in the Fed funds rate also does a very good job forecasting the *rate* of YoY change in payrolls 12 to 24 months out, as shown in the below graph (note that the Fed funds rate is inverted, so that a rise in that rate forecasts a deceleration in YoY jobs growth):”
I concluded that “Currently [in March 2018] the spread is about +0.7%. Note that if the rate of YoY payrolls growth continues to decelerate at its pace from the last several years, and we get the three expected Fed funds hikes this year, we will probably cross the +0.5% threshold by year’s end.”
In the last year, I haven’t referred to this model very much, and there’s a reason: it really hasn’t panned out.
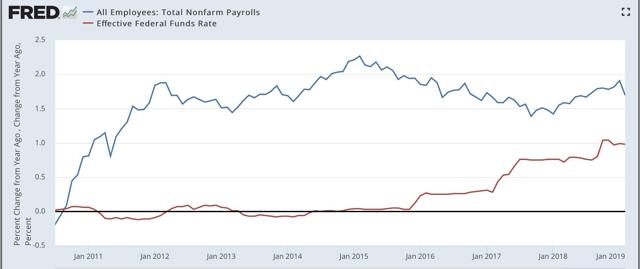
To begin with, the YoY growth rate of jobs, instead of declining towards the rate of change in the Fed funds rate, instead increased (at least through January!):
More importantly, the model specifically forecast that the second derivative, i.e., the rate of change in job growth, followed the inverse of the change in the Fed funds rate (i.e., an increase of 1% in the Fed funds rate should lead to a decrease of 1% in the rate of job growth YoY). Instead, the opposite happened:
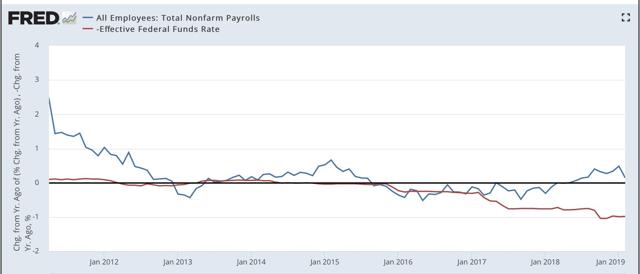
The only manner in which the analysis held up is that the rate of change in jobs growth never did decline to below +0.5% YoY, which almost always indicated a recession was near (note the graph below subtracts -0.5% from the result, so that the zero line is the decisive point):
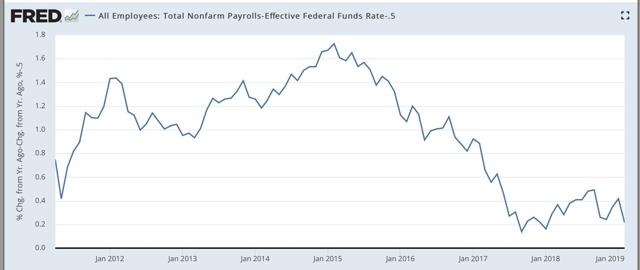
So the forecast from one year ago of a decline in jobs growth to 0.5% of less was a complete bust.
Most likely, this was because of the boost to consumption spending beginning in late 2017 first as part of recovery efforts from the hurricanes and fires that year, and second as part of the tax cut stimulus (which even if inefficient and inequitable, was nevertheless a stimulus).
With these two factors no longer in play in YoY numbers, will the relationship reassert itself, in part or in full, completely knocking out the 2018 job gains? I don’t know. If something significant happens to answer this one way or the other, I will update.
But, because the forecast was so incorrect in 2018, I am reluctant to rely upon it as a “no recession” indicator now.