Tracking Trump’s tariffs: US vs. Canadian rail loads
Tracking Trump’s tariffs: US vs. Canadian rail loads
Let me start out by saying that there is an excellent case for the US imposing a VAT (“value added tax”) similar to those enacted by Canada and European countries in order to recapture the losses due to far lower wages in China and other developing countries. Additionally there is an excellent national security rationale for not entering into”free trade” agreements with authoritarian governments who will use the benefits to build up their militaries. Not that this is what Trump is doing, of course.
In any event, I’ve already noted that the weekly rail report by the AAR seems like an excellent way to track the impact of Trump’s tariffs, especially via intermodal units which are used for ocean shipping. This week I happened on another excellent usage: comparing US vs. Canadian real loads, both of which are monitored weekly by the Association of American Railroads.
To the point, here’s what year to date growth in US (first graph) and Canadian (second graph) rail loads looked like 2 months ago:


Note that carloads, especially of various agricultural products, were reasonably comparable in the two countries.
Now here are the same two graphs updated through this past week:

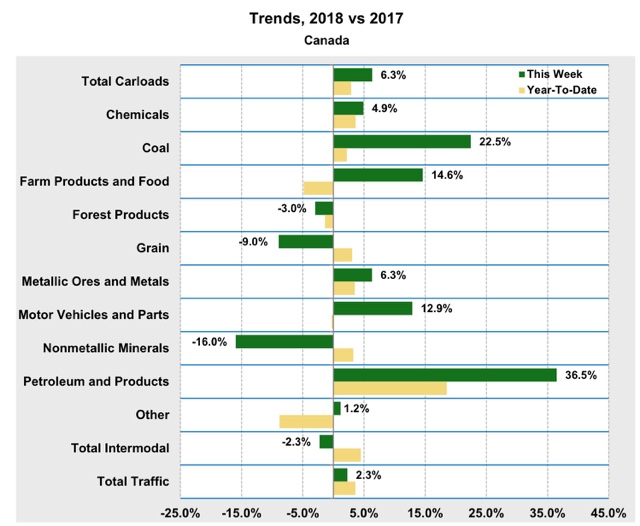
With the exception of forest products and grain, YTD comparisons are still positive in Canada.
But look at what has happened in the US. All of the YTD and YoY weekly comparisons have collapsed, and the latter have turned completely flat or negative.
This is incontrovertible evidence that Trump’s tariffs are hitting US agriculture – and transportation – hard.
“This is incontrovertible evidence that Trump’s tariffs are hitting US agriculture – and transportation – hard.”
With all due respect this is not news.
We already knew that China was retaliating against US agriculture in response to President Trump’s tariffs on Chinese goods. And since agricultural products are not very expensive, I assumed that vast quantities of them were being transported to China but now are not.
Here are links to articles about China’s soybean imports. They paint a more limiting picture of China’s ability to harm US soybean farmers:
“Soy is the number one item China buys from the U.S. and a top three item from Brazil. “
From: https://www.cnn.com/2018/10/01/economy/china-soybeans-trade-war/index.html
“Boycotting US soybeans by turning to Brazil’s bumper harvest seems like an ace in the hole for Beijing, since soybeans alone account for 10 per cent of total US exports to China.”
From: https://www.scmp.com/news/china/diplomacy-defence/article/2152109/why-china-cant-count-brazil-fill-soybean-gap-its-trade
“This dynamic will shift after September, however, when Brazilian harvests are mostly exported, and international buyers must turn instead to US supplies.”
From: https://www.scmp.com/news/china/diplomacy-defence/article/2152109/why-china-cant-count-brazil-fill-soybean-gap-its-trade
“At 97 million tonnes, China’s soybean imports in 2017-18 account for 30 per cent of total production in the rest of the world, gobbling up almost the equivalent of total production in the US (119.5 million tonnes) and Brazil (119 million tonnes).”
From: https://www.scmp.com/news/china/diplomacy-defence/article/2152109/why-china-cant-count-brazil-fill-soybean-gap-its-trade
“But as Brazil soy is not limitless and low prices have many traders holding onto what they have anyway, they will end up selling less to Europe, the world’s No. 2 soy market after China. Less Brazil beans to Europe means more American beans to Europe. “
From: https://www.forbes.com/sites/kenrapoza/2018/08/15/trade-war-update-china-soy-tariffs-brazil-trump/#42be0da22bc7
“Soy futures are expected to fall a little further if the U.S. harvest this fall is as good as the market forecasts. Soy prices are around $8.38 a bushel in the U.S. and over $10.50 per bushel in Brazil. China effectively gave itself a global soybean tariff.”
From: https://www.forbes.com/sites/kenrapoza/2018/08/15/trade-war-update-china-soy-tariffs-brazil-trump/#42be0da22bc7
And lastly. Are the Chinese now importing something close to what they export to the US? Have the Chinese stopped stealing intellectual property from US companies in China? Have Chinese companies stopped modifying pc boards in a way that would enable China’s intelligence services to monitor US companies and defense department communications?
Jim:
The number of links tossed you into moderation. I think 4 is the magic number and you end up there. Sorry for that.