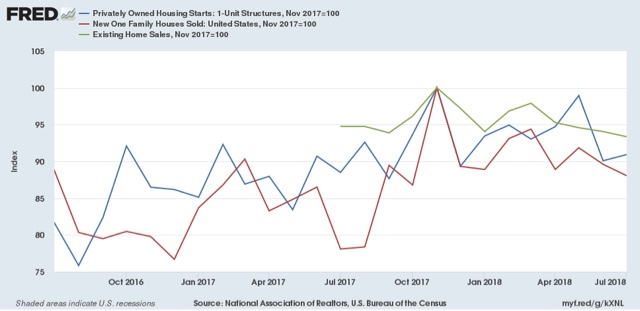
Three of the series — new home sales, existing home sales, and single family starts — all peaked last November:
That made me go back and think about an anomaly I had noticed, but hadn’t figured out, with regard to the rental vacancy rate:
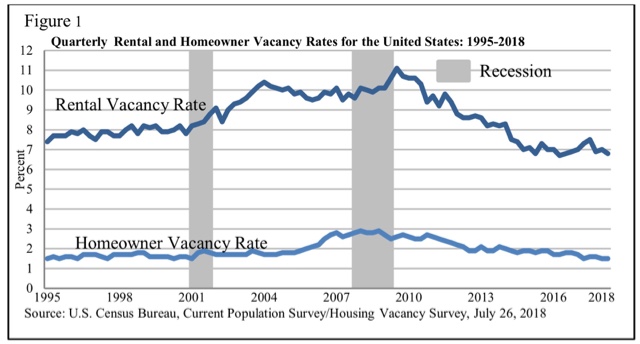
which, according to the graph, peaked in the 3rd Quarter of last year, and has declined since.
It occurred to me that this is probably not a coincidence. If housing unaffordability has become a real constraint for potential buyers, then there should be an increasing number of such buyers who are forced to rent instead — which would drive down the rental vacancy rate.
It also looks like the rental vacancy rate peaked in 1997-98 and early 2004, in advance of the last two cyclical housing peaks, which I suspect is also not a coincidence.
So, is there a leading signal for the housing market in the rental vacancy rate? My preliminary perusal makes me think it’s complicated. I’m chewing it over.
Rental vacancy going up as home ownership went up with the mortgage scam/bubble?
In the old days when conditions for the housing market deteriorated
builders would drop out of the low or cheap end of the market first.
Since the old home price indices were not quality adjusted this would generate an artificial rise in new home prices. But it did not impact
existing home sales nearly as much. So when the ratio of new to existing home sales prices rose it was a leading indicator of problems ahead
in the housing market.
The reverse happened in an improving markets.
For years I used this ratio as a very good buy-sell signal for home builders stocks.