Labor force participation, unemployment, and wages: an update
About a year ago I wrote a series of posts on the relationship between the unemployment rate, labor force participation, and wage growth. Especially in view of last Friday’s jobs report, which showed blockbuster hiring, but a continuation of tepid wage growth over 8 years into the expansion, now is a good time for an update.
To recapitulate, history shows that wage growth is lags the economy, and specifically only turns after the unemployment rate begins to decline. More specifically, since 1994, once the underemployment rate has fallen below about 9% (red, inverted in the graphs below), wage growth (blue) has begun to improve:
Meanwhile, the YoY% change in the prime age labor force participation rate turns about one year before wages (green):
On the other hand, the absolute *level* of prime age labor force participation only bottoms *after* wages have turned:
Here is the monthly graph through last Friday, whowing that all three metrics have continued to improve:
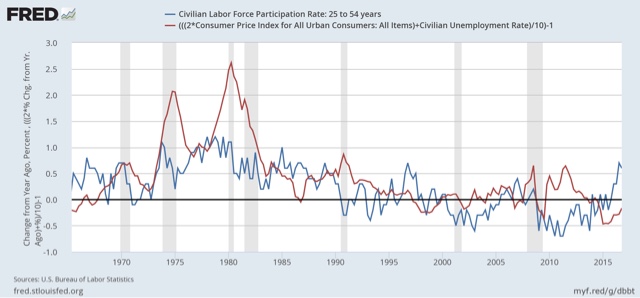
In historical context, last year I suggested that the traditional Phillips curve, which posited a relationship between lower unemployment and higher wage growth and inflation, is best seen as a special variant of a broader relationship between the labor force participation rate (i.e., the total of those both employed and unemployed). On a secular basis, the correlation has been that the YoY change in labor force participation (blue in the graphs below) appears to lead improvement in wage growth (red) by about one year. Here’s the high-inflation, high labor bargaining power 1960s and 1970s:
and there is the low inflation, low bargaining power era since 1988:
In both of these eras, generally participation led wage growth by about one year.
Last year I also suggested that a more nuanced cyclical feedback mechanism appeared to be that too rapid an increase in participation will lead either to higher inflation (the 1960s and 1970s) or lower short term wage growth (the 1980s to present. I showed that via a variation on the misery index that double-weighted inflation, in which the only major departures were the Oil shocks of 1974, 1979, 1990, and 2008:
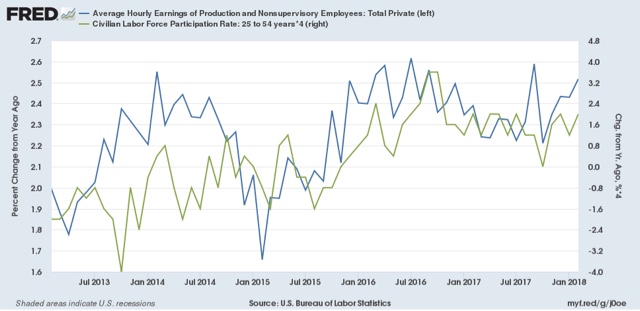
Here is an updated graph of wage growth (blue) and prime age labor force participation (green, right scale) through Friday:
In accord with my hypothesis last year, the continuing surge of participants into the labor force has acted to depress wage growth.
So, in sum, the trends remain positive, but an acceleration of wage growth probably won’t happen until this surge subsides.


“the continuing surge of participants into the labor force has acted to depress wage growth.”
No surprise there.
NDD, & Run, not only no surprise there, but also a tell tale about how badly the economists had done in estimating “full employment”. It looks like we need several months more to actually get closer to reality on “full employment” estimates. A new norm building?
My favorite ratio to watch is the employment to population rate. Of course if one specifies the labor force participation rate and the unemployment rate – one already has the employment to population ratio.
This is Eddie Lampert trying to fool us again!
Nick Bunker has an excellent discussion:
http://cdn.equitablegrowth.org/wp-content/uploads/2017/10/11124521/101217-lab-wag-ib.pdf
A portion:
“Indeed, the unemployment rate currently does not do a good job of predicting wage growth. What the data show is that a given unemployment rate can be associated with a wide range of wage-growth levels. This issue brief examines, through regression analysis, the strength of the relationships between various measures of labor market slack and wage and compensation growth. The strongest association for wage and compensation growth is with the prime employment rate, the share of workers ages 25 to 54 with a job. This statistic still stands below its pre-recession peak, suggesting the U.S. labor market is not yet at full employment.”
I suggest that the rate at which people decide to enter the workforce depends on how much work it takes to find a job. I would look for a metric of how many interviews per job and/or how many applications per interview. This is related to how long unemployed between jobs, but it is not the same because as EPOP increases you reach people with lower marginal propensity to spend time looking for work.
Economists underestimate the value of leisure.