[Note: This is a post I was working on last week. I hypothesized that the employment cost index would validate the analysis. Well, I didn’t get around to posting it, and the ECI came out this morning. So, how did I do? ]
Last week the Bureau of Labor Statistics reported that real weekly median wages declined by over 2% in the 4th quarter of last year! This is quite the anomaly in the face of generally good data that has been reported in the last few months.
But I thought I would dig deeper to see why the anomaly had occurred. So I took a detailed look at each of the three qualifiers: “real,” “median,” and “weekly.” Where did the downturn come from?
Well, part of it certainly had to do with inflation. Recall that one of my favorite measures, “real aggregate wages” actually peaked in July and has declined -0.8% since then, mainly due to an uptick in inflation. It is easy to break that out, since the BLS also releases nominal weekly wage data. So here are the two together for comparison:
The uptick in inflation is responsible for about 1/3 of the decline in real weekly median wages.
Next, let’s take a look at average hours worked per week:
These actually increased between the 2nd and 4th quarters. So it’s not that fewer hours are being worked per week.
Is something going on with the “median” vs. “average” measures? The next graph compares the weekly measure with real average hourly wages:
Median wages declined more than average wages. So that tells us that the main thing that probably happened had to do with the makeup of the labor force.
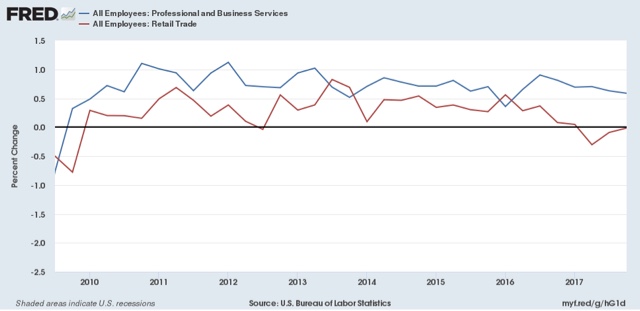
To check that, I compared job growth among professional and business workers (a high-paying category) vs. retail workers (a low-paying category). How much did each grow during recent quarters? Here’s what I found:
Eureka! Professional and business hiring has remained fairly steady, even having a small bump in the second quarter. But the retail apocalypse manifested itself by outright declines in the 3rd and especially second quarters, vs. flatness in the 4th.
It appears the actual outliers were those two quarters rather than the 4th quarter. The downturn in low paying retail jobs in the middle quarters of 2017 made the median 50th percentile worker someone who worked in a somewhat higher paying job.
The best way to test this hypothesis is to see what happened quarter over quarter to pay for identical jobs. That is exactly what gets measured by the Employment Cost Index. If what mainly happened in the 4th quarter is that the mix of jobs in the economy changed, then the only decline we should see in the E.C.I. is that due to inflation. That report comes out next week, so we will have the answer soon enough.
—-
AAAAND, this morning the Employment Cost index showed that wages *ROSE* 0.5% in Q4, and total compensation rose 0.6%. The nominalYoY% increase for each was 2.5%:
In real, inflation adjusted terms both wages median compensation declined -0.3%:
So the big dropoff in weekly median wages does indeed appear to be a story of a change in the mix of jobs, rather than a drop in actual pay of a job. Still, nominal wage growth in the latter part of 2017 was eclipsed by the uptick in inflation. This, by the way, adds to the evidence that the increase in consumer spending in the last few months has been driven by the wealth effect (increasing house and stock prices for the affluent and wealthy) and dipping into savings for everybody else.


“AAAAND, this morning the Employment Cost index showed that wages *ROSE* 0.5% in Q4, and total compensation rose 0.6%. The nominalYoY% increase for each was 2.5%: In real, inflation adjusted terms both wages median compensation declined -0.3%:”
A crucial AAAAAND! Menzie Chinn talked about one of these real series and of course one of his right wing trolls chastised him for being a liberal idiot because … ECI. Of course Menzie was careful to discuss real compensation and our right wing Nobel Prize winner cited a nominal series.
From Q3 2014 to Q3 2017 real median gain was 2.6% or < 0.9%/year.
The real median gain in 2016 was completely wiped out by Q3 2017.
Neither the 3 year period from Q3 2014 or the 2016 to Q3 2017 support the purported labor demand growth relative to labor supply I keep hearing about from the right.
And here we have liberal idiots that deny labor force participation and employment to population ratios declined between 2000 and 2017 because of the baby boomers reaching retirement age.
https://www.philadelphiafed.org/-/media/research-and-data/publications/research-rap/2013/on-the-causes-of-declines-in-the-labor-force-participation-rate.pdf
Anti-intellectualism runs rampant on the extremes – left and right.
My apology for hijacking NDD thread and sorry PGL, I have had enough. This is from a September 2016 BLS report “Labor force participation: what has happened since the peak?” on the various age and gender groups feeding into the decrease of PR. The data is from 1985 to 2015.
“After rising steadily for more than three decades, the overall labor force participation rate peaked at 67.3 percent in early 2000 and subsequently fell to 62.7 percent by mid-2016. In recent years, the movement of the baby-boom population into age groups that generally exhibit low labor force participation has placed downward pressure on the overall participation rate.
From 2000 to 2015, the decline in participation occurred across most of the major demographic groups. Teenagers experienced the steepest drop in participation, which coincided with a rise in their school enrollment rate. Yet, labor force participation rates of both teenagers enrolled and not enrolled in school fell since 2000. Adults 20–24 years showed a decrease in labor force participation that was less steep than that of teenagers. The young adults least likely to participate in the labor force were those without a high school diploma, in particular young women, especially mothers.
The labor force participation of women 25–54 years also declined from 2000 to 2015. This decrease was most pronounced for women who did not attend college. Women with a college degree experienced a much smaller reduction in labor force participation. Since 2000, labor force participation of mothers with children under 18 years old has receded; the declines were larger among less-educated mothers.
The labor force participation of men 25–54 years continued to decline from 2000 to 2015. The decrease in participation among men with less education was greater than that of men with more education.
The labor force participation of men and women 55 years and older rose from 2000 to 2009 and subsequently leveled off. This plateau could be attributed partially to the fact that the oldest baby boomers reached age 62 in 2008 and became eligible for Social Security retirement benefits.”
So much for the plateau in 2008. Lets look at some charts and graphs:
and here are some numbers:
While groups in their mid-fifties experienced decreases in PR, the older groups showed greater PR. The study itself says the decrease was experienced in the less than 55 age groups.
Jay Bird continues to go off topic:
“And here we have liberal idiots that deny labor force participation and employment to population ratios declined between 2000 and 2017 because of the baby boomers reaching retirement age.”
Ah Jay Bird – as I said the last time you posted this, no one is denying that this PART of the story. And your own source notes there are other factors.
Could you please stop this pathetic trolling?