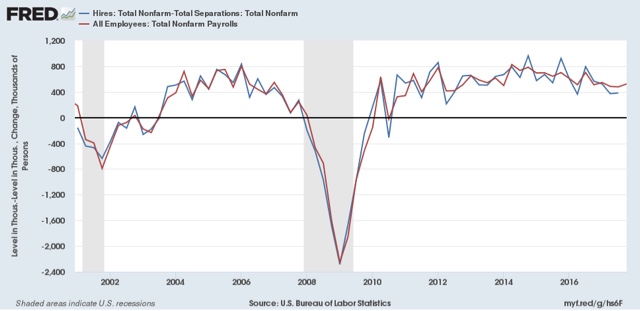
I’m changing my presentation of JOLTS data somewhat compared with the last year or two. At this point I’ve pretty much beaten the dead horses of (1) “job openings” are soft and unreliable data, and should be ignored in contrast with the hard “hires” series; and (2) the overall trend is that of late expansion but no imminent downturn.So let’s start a little differently, by comparing nonfarm payrolls from the jobs report with what should theoretically be identical data: total hires minus total separations in the JOTLS report, monthly (first graph) and quarterly (second graph):
While there can be a considerable disparity in any one month, once we start looking longer term there is an incredibly tight fit.
For our immediate purposes, it’s likely that the strength in the JOLTS hiring data over the last several months is the same trend as the very good post-hurricane October and November jobs reports, both of which showed that more than 200,000 jobs had been added. While any given month can be off significantly, it’s a fair bet that when the December JOLTS report is released in one month, it too will be weaker, just as was the December jobs report.
Just as at the bottom of the Great Recession, at the end of the “shallow industrial recession” of 2015, hiring (red) troughed first, followed later in 2016 by separations (blue). With hiring up, I expect the level of separations to also increase (note some of these are voluntary) in the next few months as well.
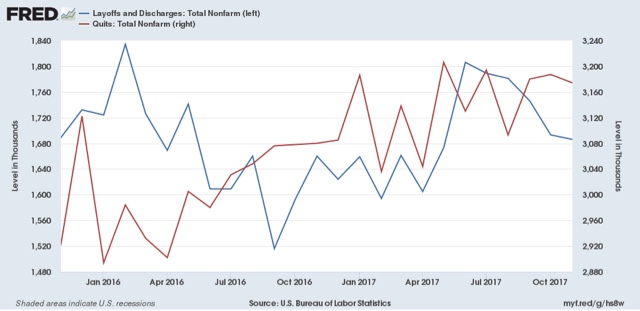
[Note: above graphs show quarterly data to smooth out noise]Here are hires vs. separations on a monthly basis for the last 24 months:
While quits remain at expansionary high levels, they seem to have stagnated in the last 6 months. With hiring increasing again, if the pattern from the last decade holds, I would expect quits to improve somewhat as well.
Meanwhile the good news is that involuntary separations have fallen in the last several months, even if we average the last two. At the same time, they remain above thei bottom they established a year ago:


Much better now that you’ve finally abandoned the use of “openings” as having any relevant correlation with hires. However, I’m surprised you didn’t do this long ago.
What I’m curious about though is voluntary Quits.
Quits are assumed to mean exchanging one job for another such that … the new job offers some advantage to the person quitting.. better benefits, shorter commute, better advancement opportunities, better salary/wage, better working conditions and policies, etc..
If this were the case then there would be a small time lag (at most) between quit and subsequent hires There would be virtually no time lag for the bulk of jobs in the lower wage/salary sector so in most cases a less than 1 month lag — e.g. below resolving power.
But I’m not at all convinced that the assumption is even close to true, based on my own personal knowledge of over 35 years experience, and of volumes of knowledge I obtained from acquaintances, relatives, friends, and random people I’ve met.
A relatively high proportion of voluntary quits are not actually voluntary at all.. they are coerced …. essentially be fired involuntarily (by which you gain unemployment insurance),or take this severance package, or be demoted with a wage/salary cut, or be transferred to Timbuktu in the outback of civilization, etc.
Coerced “voluntary quits” are then forced to go job-hunting and at the lower wage / salary segment this coerced “voluntary quit” occurs within a day or two or at most a week of being offered to be fired or sign the voluntary quit form…. before the next job can be secured. At higher income levels the coercing employer will give the coerced employee a couple of weeks of paid time off to job hunt (usually one pay period) before the involuntary firing or coerced “voluntary” quit decision has to be made.
I don’t know the proportions of coerced v actual voluntary quits . a rough guess based on my 35+ employed years and direct knowledge (though it never applied to me directly) is that it can be up to 15% – 20% of quits are coerced .. thus actually involuntary fires in fact.
I even witnessed a massive round of layoffs (600 highly paid professionals) taking place over the course of a full year where about 80% took the “severance” rather than have to relay on unemployment checks,. and nobody knew before being told they were being “laid off” that they were even a potential target. This was done ultra quietly always on a Friday afternoon and the employee “walked” out of the building — and were allowed to return on the weekend to pick up their personal belongings.
So the question is shouldn’t the voluntary “quits” numbers be factored UP by some average not insignificant percentage in the national composite, and wouldn’t the percentage mark-ups be greater for lower wage sectors than higher ones?
Also I’m curious why you don’t use sum of Quits and Discharges subtracted from Hires (on quarterly basis) to show NET Hires over time.
Wouldn’t that be a more accurate Hiring trend indicato?
Finally, one last thing,
Payrolls = Existing at Time 0, + Hires at T(i) – (Discharges at T(i) + Quits at T(i) for i = 1 to n periods.
Therefore unless Existing Payroll at Time 0 = 0, Payroolls cannot be equal to Hires – Discharges as you state in your opening paragraph &show in your first two charts. Perhaps the vertical axis is “change” rather than absolutes numbers but I can’t read the vertical axis labels on the charts you provided, even clicking on them and then zooming to higher levels.