Housing, the Fed and M3
The Federal Reserve has been sounding the alarm: the housing market is on fire!
It started with Kohn 4/22/2005.
“Prices have gone up far enough since [a couple of years ago] relative to interest rates, rents, and incomes to raise questions; recent reports from professionals in the housing market suggest an increasing volume of transactions by investors, who (along with homeowners more generally) may be expecting the recent trend of price increases to continue.”
Then Chairman Greenspan 5/20/2005 (in Q&A):
“… only those who have purchased very recently, purchased just before prices actually literally go down, are going to have problems.”
Guynn 5/25/2005 (in Q&A):
“Some buyers, some builders, some lenders are going to get burned …”
And now Ferguson 5/27/2005:
“…right now, housing prices in many markets in the United States are relatively high when judged by conventional valuation measures”
The comments from Federal Reserve Vice-Chairman Roger Ferguson are from his speech in Berlin titled “Asset Prices and Monetary Liquidity”. In the speech Ferguson discussed possible links between “excess liquidity” and asset prices; both equities and housing. With many cautions and caveats, Ferguson suggested that there was no obvious correlation between liquidity and equity prices, but that housing prices were somewhat correlated to M3 across many countries and periods.
Dr. Ferguson presented the following figure and discussion to show the historical relationship between housing prices and M3:
Click on graph for larger image.
“The solid line in figure 3 shows the average behavior of the growth rate of M3 from twenty quarters before a peak in real house prices until twenty quarters after the peak, where the average is taken across all the cyclical episodes in our broad sample. The broken line in the chart is the log level of real house prices indexed to zero in the peak year. As can be seen from the chart, on average the growth rate of money increases fairly steadily until around two quarters before the peak in real house prices and then drops fairly steadily for ten quarters afterward before recovering somewhat. Although there are some variations, this pattern tends to occur in most countries’ episodes.”
As a follow up to Dr. Ferguson’s speech, the following chart shows the real prices of housing nationwide since 1976. This data is from the OFHEO home price index, a “constant quality” index that is based on repeat transactions of individual homes. The nominal prices are adjusted with CPI less shelter.

NOTE: Chart starts at 80 (instead of 0) to better show when price declines started, not magnitude of the decline. For a discussion of price declines in previous busts see “Housing: After the Boom“.
This clearly shows the nationwide real price declines for housing in the early ’80s and early ’90s. In Ferguson’s speech, he presented a similar figure that included the early / mid-70’s housing bust (see figure 2).
The following graph is of the price adjusted value of M3 for the same period. The vertical lines indicate when housing peaked in the previous cycles.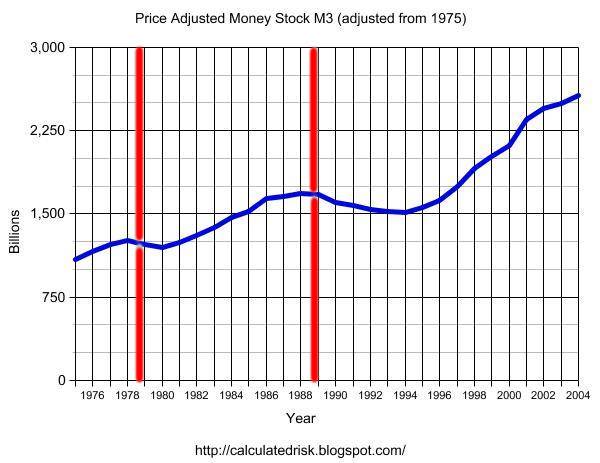
It is important to repeat Dr. Ferguson’s caution regarding not confusing correlation with causation, but it does appear that housing has peaked in the past when price adjusted M3 has peaked. Price adjusted M3 appears to be peaking right now: April 2005 only saw a 1% increase YoY.
Here a couple of more comments from Ferguson. On housing valuations:
“For housing, rent-to-price ratios and income-to-price ratios are commonly used measures to assess valuation. Over the past several years, both measures have decreased sharply in many countries, and they currently are well outside historical ranges in some countries.”
For an interesting discussion on this topic, see General Glut’s post today.
And finally, Ferguson expressed concern about the impact on the economy of a housing bust:
“In a scenario of collapse, the damage to balance sheets and private wealth could go as far as undermining the soundness of the financial system and threatening stability of the real economy.”
The NY Times had an excellent article on this topic on Saturday: “Hear a Pop? Watch Out“. I also discussed this topic earlier on Angry Bear: “After the Housing Boom: Impact on the Economy“.
Finally there were too many housing related articles this weekend to comment on them all. As an example, did you know that Georgia leads the nation in Interest Only loans? That was a surprise to me! See Patrick’s links for a list of recent housing related stories.
Best Regards, CR Calculated Risk