Oil: The Impact on the US Economy
First, the good news: Oil futures (West Texas Intermediate:WTI) for May delivery are only $52.95 per barrel, off from the recent high of $58.28 per barrel. And it appears gas prices may be peaking for the current driving season at around $2.30 per gallon. Perhaps that will be the end of stories like the following for awhile: “Average Gas Price at Record $2.29/gal”.
But oil prices are still substantially higher than a year ago. WTI was selling for under $35 per barrel in April 2004. Now it is 50% higher. So the question is: What will be the impact of these higher prices on the US economy?
Graphs like the following, from the DOE, are being used to show that real gas prices are still lower than prices in the early ’80s. That is true, but current real gasoline prices are higher than after the ’73 oil price shock. Note that this graph was produced at the end of last year and the current price of $2.30 per gallon is substantially higher than the DOE’s projection of $2.00 per gallon.

Click on graph for larger image.
Both the ’73 and ’79 oil price shocks preceded recessions in the US. After the ’79 oil crisis, unemployment peaked at 10.8% in 1982. After the ’73 price shock, unemployment only reached 9%. It is not comforting that the real price for gasoline is above the peak of the ’73 crisis.
Dr. Altig of Macroblog has a graph showing US energy usage / real GDP for the last 50 years. Altig’s graph shows the US economy has become steadily more efficient in terms of GDP per unit of energy consumed. But for this post, I will focus on the impact of the price of oil. The following graph shows the US consumption of oil, in millions of barrels per day.

After peaking in the late ’70s, US oil consumption declined for several years. This was due to a combination of a US recession, more efficient automobiles, less oil in electricity generation and more efficient industry. The following graph shows oil consumption by sector. The industrial sector has never returned to the 1979 consumption levels (due to a combination of efficiencies and substitutes) and “other uses” has also declined significantly, primarily because electricity generation has moved away from oil. This leaves motor fuel and “other transportation” as the major growth sectors for oil consumption.

This indicates that any reduction in oil consumption will have to come mainly from transportation. To reduce oil consumption for transportation, people will have to drive less, buy more efficient vehicles, or substitutes, suitable for transportation, will have to be found.
The next graph shows total US oil consumption and imported oil consumption, in dollars, as a % of GDP. US oil consumption was around 2% of GDP until the 1973 oil crisis when it jumped to 2.8% of GDP. After the 1979 oil shock, oil consumption jumped to 6% of GDP. For comparison, in 2004 oil consumption was 2.2% of GDP (imported oil was 1.27% of GDP).
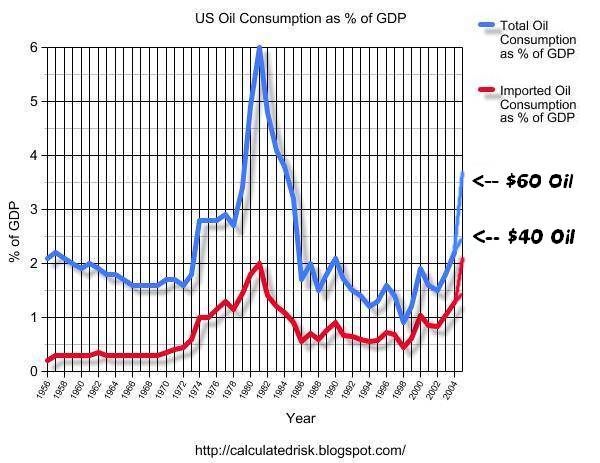
On the above graph, I added the impact of $40 and $60 oil for 2005 (enlarge graph to see). For $40 oil, consumption will be almost 2.5% of GDP. For $60 oil, consumption will be 3.7% of GDP – substantially higher than during the 1973 oil crisis. For this calculation, I assumed 6% nominal GDP growth for 2005.
NOTE: These prices for oil are the average contract price paid for various grades of oil. This average is usually $5 to $10 below the spot price of WTI.
Note that I also plotted the percentage of GDP used to consume imported oil. Although imported oil keeps US energy costs lower than otherwise (we would have to use expensive substitutes to replace the oil), it also removes money from the US economy. At $60 per barrel, imported oil alone will be 2.1% of GDP in 2005.
The importance of imported oil is growing. The following graph shows the quantities of domestic and imported oil for the last 50 years. (SOURCE: DOE) This chart includes “Natural Gas Plant Liquids” and “Other Domestic Sources” as part of the domestic supply.

In summary, both oil consumption as a % of GDP and real gas prices, will probably be higher in 2005 than after the 1973 gas crisis, but lower than after the 1979 oil shock. Economist’s predictions on what price of crude would push the economy into recession have been moving higher. (See Kash’s post from Friday. I think a sustained contract price of over $50 (or WTI price close to $60) would probably trigger a consumer recession in the US.
CR: Calculated Risk