Housing: Speculation is the Key
I have taken to calling the housing market a “bubble”. But how do I define a bubble?
A bubble requires both overvaluation based on fundamentals and speculation. It is natural to focus on an asset’s fundamental value, but the real key for detecting a bubble is speculation – the topic of this post. Speculation tends to chase appreciating assets, and then speculation begets more speculation, until finally, for some reason that will become obvious to all in hindsight, the “bubble” bursts.
Speculation is the key.
A recent report by the National Association of Realtors (NAR) reported that 23% of all homes nationwide were bought by investors. Another 13% of homes were purchased as second homes. In Miami, it was reported that 85% of “all condominium sales in the downtown Miami market are accounted for by investors and speculators”. This is clear evidence of speculation.
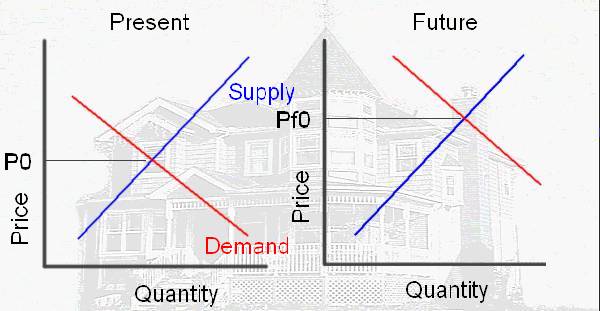
The following supply demand diagrams illustrate this type of speculation.
Click on diagram for larger image.
The above diagram shows the motive for the speculator. If he buys today, at price P0, he believes he can sell in the future at price Pf0 (price future zero), because of higher future demand. The speculation would return: Profit = Pf0-P0-storage costs (the storage costs are mortgage, property tax, maintenance, and other expenses minus any rents).
In this model, speculation is viewed as storage; it removes the asset from the supply. The following diagram shows the impact on price due to the speculation:

Since speculation removes the asset from the supply, the Present supply curve shifts to the left (light blue) and the price increases from P0 to P1. In the second diagram, when the speculator sells, the supply increases (shifts to the right). The future price will fall from PF0 to PF1. As long as (PF1 – storage costs) is greater than P1 the speculator makes a profit.
However, if the price does not rise, the speculator must either hold onto the asset or sell for a loss. If the speculator chooses to sell, this will add to the supply and put additional downward pressure on the price.
This type of speculation appears to be rampant only in certain regions, mostly the coastal areas. However, something akin to speculation is more widespread – homeowners using substantial leverage with escalating financing such as ARMs or interest only loans.
Leverage as Speculation.
In this LA Times article “They’re In — but Not Home Free“, the writer describes a woman that is “able to afford, barely, her first home”. She has taken out “an adjustable-rate mortgage that won’t require her to pay any principal for three years”. She is already strapped, working overtime to pay her bills, and doesn’t know what she will do in three years. She is a gambling that either her income will increase or that the value of her home will rise enough to sell at a profit.
Californians are adopting a “buy now, pay later” strategy on a massive scale. The boom in interest-only loans — nearly half the state’s home buyers used them last year, up from virtually none in 2001— is the engine behind California’s surging home prices.
See article for graphic on “Risky Debt”. Here is a similar article in the Sunday Washington Post, “Homeowners in Harm’s Way” and a summary of financing options from the WSJ Online: “Buy Now, Pay Later“
This type of leveraged activity pulls demand from future periods. Starting with the first diagram above, these leveraged financing programs shift the demand curve to the right (light red) and increase the price from P0 to P1. In the future, the demand will be shifted to the left and the future price will be Pf1. If Pf1 is less than P1 (the LA Times buyer’s price), then her house might be foreclosed, increasing the supply too!

One way to prolong the bubble is to offer ever more leveraged financing. And here it is – a 35 year loan, interest only for the first 5 years, with no money down and 103% Loan To Value (to cover closing costs). Amazing.
How many people are on the ragged edge? From the LA Times article:
The number of buyers falling into this category in any given month is unclear. But a California home builder recently got a sense when he sought to answer this question: How many of the potential buyers of his houses could still afford them if interest rates went up even a little?
To find out, the builder conducted a little experiment.
His firm’s preferred lender had pre-qualified 90 potential buyers for a group of new houses. Since the houses wouldn’t be ready for another six months, the builder tightened the loan criteria. He didn’t want buyers to sign up for a house and then get frightened into canceling by rising rates.
He raised the threshold from a fully variable loan, the easiest to get since it immediately moves upward when rates increase, to a mortgage that was fixed for the first three years. That would shield buyers from rate jumps for at least a little while, but it’s also more expensive.
Under the higher threshold, only about 15 of the buyers still qualified.
Only one in six buyers qualified for a slightly higher financing package. I believe that means we are close to the end of the housing cycle. Both types of activities are increasing prices: speculation is reducing supply and leverage is increasing demand.
The Bust
Housing “bubbles” typically do not “pop”, rather prices deflate slowly in real terms, over several years. Historically real estate prices display strong persistence and are sticky downward. Sellers tend to want a price close to recent sales in their neighborhood, and buyers, sensing prices are declining, will wait for even lower prices.
This means real estate markets do not clear immediately, and what we usually observe is a drop in transaction volumes. That is my expectation for this year: stable prices (maybe declining slightly on the coasts) and declining volumes. Stable or lower prices will halt speculation and increase the supply. And if rates rise further, or lenders become more discerning, demand will also decrease. Either spells bust for the current bubble.