Inequality Researcher David Splinter Really Doesn’t Like (or Understand) Haig-Simons Income
– by Steve Roth
Originally posted at Wealth Economics
Economists have widely ignored it, even while dubbing it the “preferred” measure of income.
“The greatest trick capital-gains
income ever managed was convincing
the world that it doesn’t exist.”
—Carlos Mucha (inventor of the Platinum Coin)
This post draws on a far lengthier and more detailed paper — including support for some claims made below, that there wasn’t room for here: “How Invisible Capital Gains Drive Extreme Wealth Concentration: Evidence from Balance-Sheet-Complete U. S. Haig-Simons Accounting.” It provides a complete and annotated spreadsheet/replication file, covering the years 1960 to 2023. That paper builds on a precursor that focused on the same issues from a somewhat different perspective: “Why the Flow of Funds Don’t Explain the Flow of Funds: Sectoral Balances, Balance Sheets, and the Accumulation Fallacy.”
David Splinter, a widely published researcher of national income, wealth, and inequality — especially in conversation with Piketty, Saez, Zucman and company, PSZ — has issued a new working “comment” paper on his site attacking a December 2024 IRS working paper by Cole Campbell, Jacob A. Robbins, and Sam Wylde (CRW): “The Distribution of Capital Gains in the United States.”
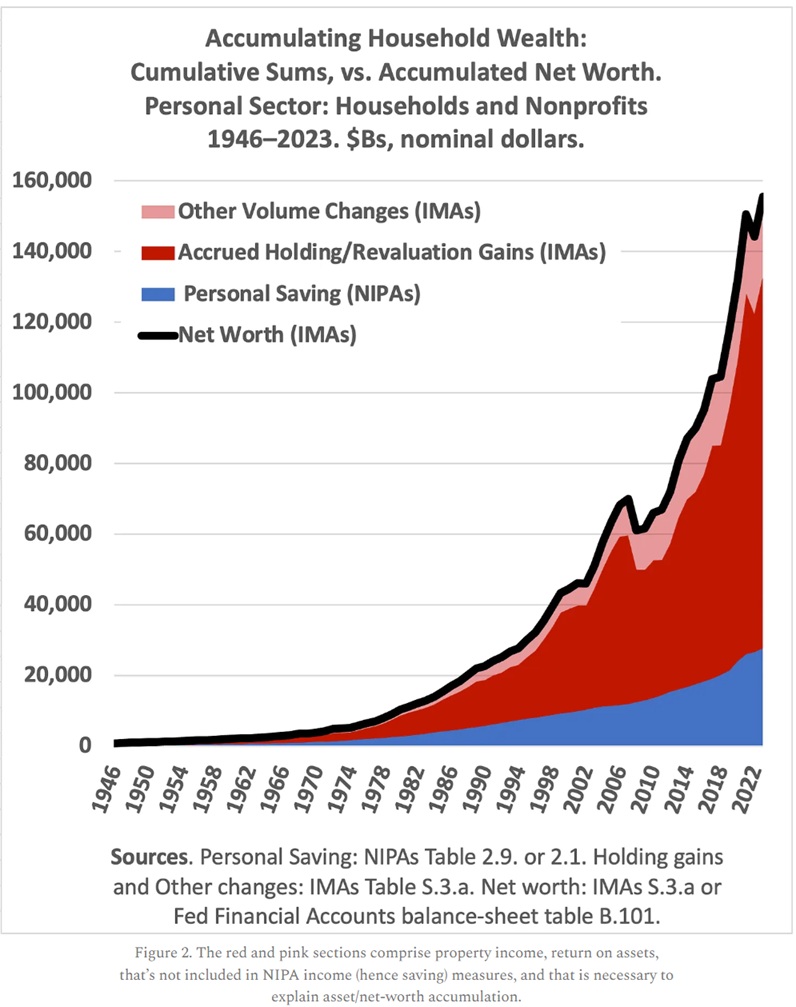
The CRW paper commits the egregious sin, in Splinter’s eyes, of employing “Haig-Simons” (H-S) income as its key measure — which is somewhat odd considering that income, wealth, and inequality researchers have for decades been referring to H-S income as the “preferred” income measure. It’s preferred, in essence, because it explains households’ balance-sheet changes. It’s “stock-flow consistent.” The standard NIPA measure of personal/household1 income that Splinter prefers doesn’t even come close. See Figure 2.
The big difference between the two measures: the NIPA’s measure of property income (income received for owning assets) only tallies asset holders’ “yield” on assets — basically interest and dividends.2 H-S income adds the capital gains that those asset holders accrue from price runups in asset markets, accumulated over years, decades, lifetimes, generations, and dynasties. (There’s also a much smaller necessary addition, Other Changes in Volume.)
So “total” or “comprehensive” H-S income3 includes asset-holders’ total return on assets — the measure than any portfolio holder sees on their brokerage’s web site as they follow their assets’ returns, year in and year out. It’s the ultima thule of modern portfolio investing, whose goal is the accumulation of balance-sheet wealth.
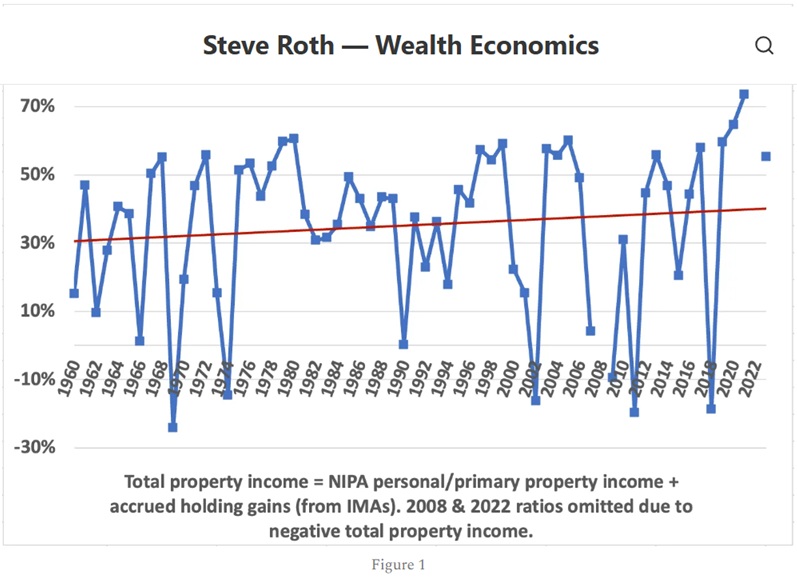
Circa 40% of households’ total return comes from holding gains, up from ~30% in the 1960s (Figure 1). Those holding gains are invisible in Splinter’s preferred NIPA income measure. Modeling the Lifetime Income Hypothesis, for instance, absent these very large measures, seems at least problematic.
This is where we come up against perhaps the most fundamental household-sector accounting identity, in the simple form that most economists and macro analysts hold in their heads:
Income – taxes, spending, and interest payments = Saving = Change in balance-sheet net worth. ∆NW.
Starting with NIPA income measures, the last “equals” identity fails badly (Figure 2). NIPA Saving doesn’t nearly explain where all the new “savings” came from — the new wealth.4 Starting with balance-sheet-complete H-S income, the match is perfect. The identity holds.
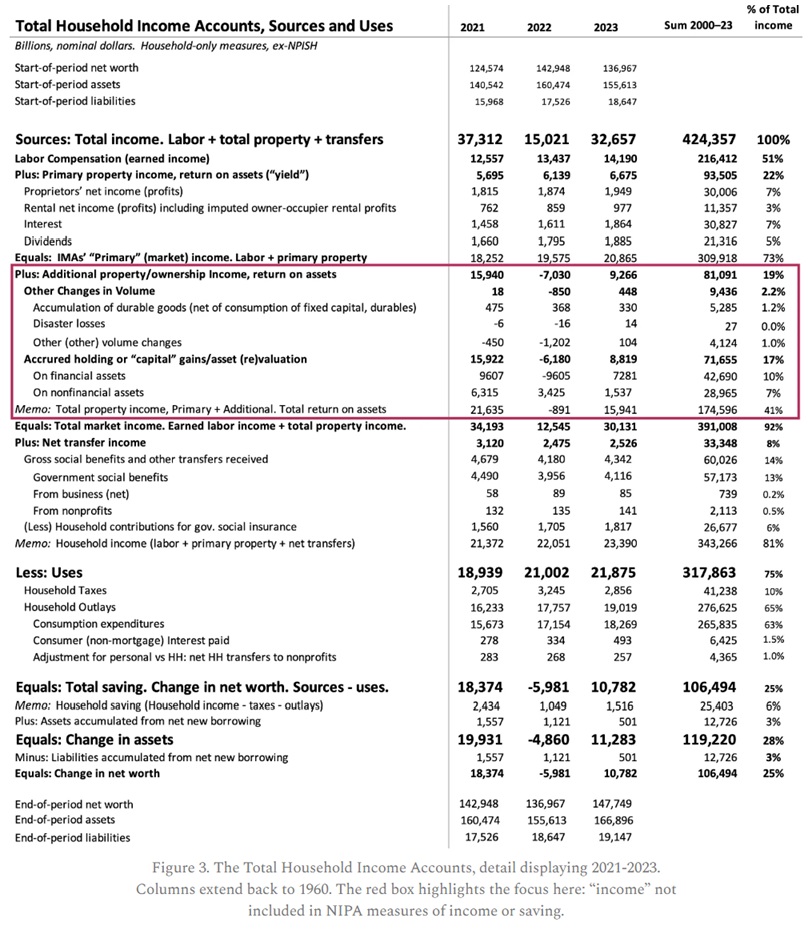
For those with a different turn of mind, here’s that situation presented in accounting-table form, organized and labeled to be understandable by a simple country businessperson like your gentle author (Figure 3).
But That’s not Real Wealth!
Two other dismayingly widespread misconceptions that Splinter deploys (there are others, too many for this post) are especially worth highlighting:
- Asset prices are volatile, so holding gains aren’t real wealth. They’re ‘windfalls,’ temporary fluctuations around some vaguely imagined measure of “true wealth.”
- Valuation gains on an asset are only “real” once they’ve been “realized.” (The asset holder has swapped the assets with another asset holder, at then-current market prices, in exchange for “cash” bank-deposit assets.)
On #1: Try telling the Walton (Wal-Mart) heirs, who’ve been accumulating holding gains on their inherited fortunes since Sam’s death more than three decades ago, that their wealth isn’t real. Tell it to tens of millions of elderly with “retirement savings.” They’re all happily spending out of those (appreciated) balance-sheet assets. So unless you’re predicting a 1929-level, enduring, “Mother of All” crash in asset values, this wealth is very real indeed.
On #2: If your ETF shares’ value and thus your balance-sheet wealth has increased in the past year and you want to spend out of that increase, swapping some of those shares for cash only requires a few mouse clicks. That’s a purely mechanical step, necessary because sellers demand, and payment-transfer systems only deal with, fixed-price cash assets. Asset holders spend out of their assets, not just out of a given moment’s “cash” holdings (a very small asset class within household portfolios).
If you step outside the single-year, single-asset view and “individualistic fallacy” where Splinter’s thinking is operating, instead looking at the household sector as a whole over time, you can perceive a very different picture (Figure 4).
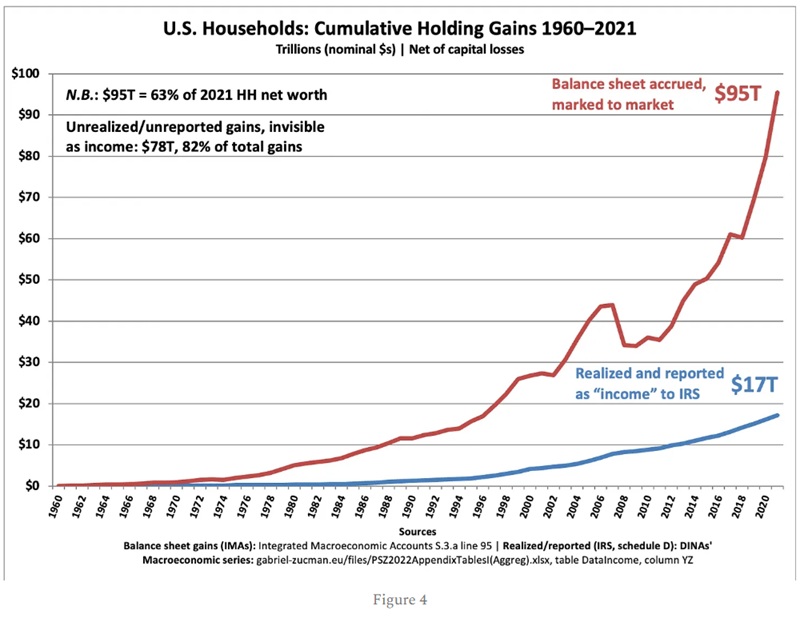
Two key takeaways from this graph:
1. There has been only one (1) significant decline in this accumulation of gains (the red line) over six decades — in 2008. Asset holders recovered to “trend” within ~5 years. So much for “temporary” and “windfall.” At least postwar, and especially since the rise of modern portfolio investing and brokerage sites calculating total returns instant-by-instant, holding gains have become a crucial part of “lifetime-income” investors’ total-return expectations, and results.
2. Measures of realized gains are immaterial to household wealth accumulation. (They get lots of attention partially because of the tax laws, which asset holders Really Care About. H-S Income discussions regularly get derailed down that rabbit hole.) Again, “realization” is just two asset holders swapping assets at current market prices, each adjusting the asset-class mix in their portfolios. Those swaps have no direct accounting effect on total wealth; they just move the assets around. In the big picture it’s “portfolio churn,” whereby some accumulate return-bearing assets, and others get cash, which they can either hold, spend, or reallocate into a different asset class with another reciprocal swap.
But That’s Not How We Do It!
Splinter’s big up-front objection is that (paraphrase) “that’s not how national accounts measure income!” And he’s correct. As he points out, Simon Kuznets, patriarchal creator of the national accounts (tasked with the job by FDR in 1932), agreed that income should not include revaluation/holding/“capital” gains, because they don’t represent current-period production. Again, correct.
But Kuznets was also clear throughout his writings that the “best” measure of income depends on the analysis being undertaken. He was focusing on analyzing production (especially as war production became crucial), and his income measure served that turn. Inequality researchers including CRW, Splinter, PSZ, and others are doing a very different analysis: household wealth and income distribution.
There are many inequality analyses worth doing, but assume we’re asking: 1. What is the distribution of household wealth across the income or wealth spectrum (or by race, age, etc.), and 2. How did different households accumulate the assets (or not) that brought about the current highly concentrated wealth distribution? The NIPAs’ balance-sheet-incomplete income measure is, on its face, by accounting identity, inadequate for this analytical task.
Kuznets also simply didn’t have the accounting data or measurement wherewithal we have today. It took a long time to build; wealth measures were especially challenging. The Fed’s Z.1 report, launched in 1959 as the Flow of Funds of the United States and since renamed as the Financial Accounts of the United States, didn’t even include the b.100 (now b.101) household balance sheet table until Q2 1997. There was no national-accounts tally of households’ holding gains until the 2006 release of the fully SNA-compliant Integrated Macroeconomic Accounts or IMAs (which have, mystifyingly, been largely ignored by economists). Unlike the NIPAs, which don’t even have balance sheets or asset/liability measures, the IMAs also include balance sheets along with holding gains and a resulting (∆)NW measure, for every sector.5
The IMAs Table S.3 makes it fairly trivial to calculate Haig-Simons income for the Personal sector: just add the IMAs’ Nominal Holding Gains and Other Changes in Volume measures to NIPA income (Figure 3). Developing distributional tables for that H-S measure is a significantly greater challenge — a challenge that the CRW paper takes up with vigor.
It’s Not Just Splinter
It’s important to highlight that David Splinter is far from alone in hewing to the standard national accounts “income” measure. PSZ and their Distributional National Accounts (DINAs, the basis for the World Inequality Database WID), and even a broad swath of heterodox/post-Keynesian analyses, do likewise.6 “National Income” is the fulcrum around which their analytics and models revolve.7 This is notably true of the Kalecki Profit Equation, for instance; holding gains are unconsidered therein.
Again, this all may be fine if the analytical goal is to estimate production. But if household wealth and its accumulation and distribution is an analytical goal, ignoring many tens of trillions of dollars in wealth accumulation, over decades, just won’t serve.
As always, comments and especially corrections from my gentle readers are deeply welcome.
1 The Personal sector (often referred to in shorthand as the household sector) includes households plus “nonprofit institutions serving households” (NPISHes). For a sense of magnitude, NPISHes hold about 6% of personal-sector assets; households own the rest.
2 The NIPA’s “yield” measure of property income also includes proprietors’s and landlords’ profits from their non-C-corp “passthrough” firms of whatever type (even a sole proprietorship reporting on the owner’s personal IRS Schedule C is a firm). Those profits are essentially dividends as well, though the firm owners can choose whether or not to distribute them. They pay taxes on them in either case. Even if they don’t distribute, they own those retained profits accumulated in the current or past years.
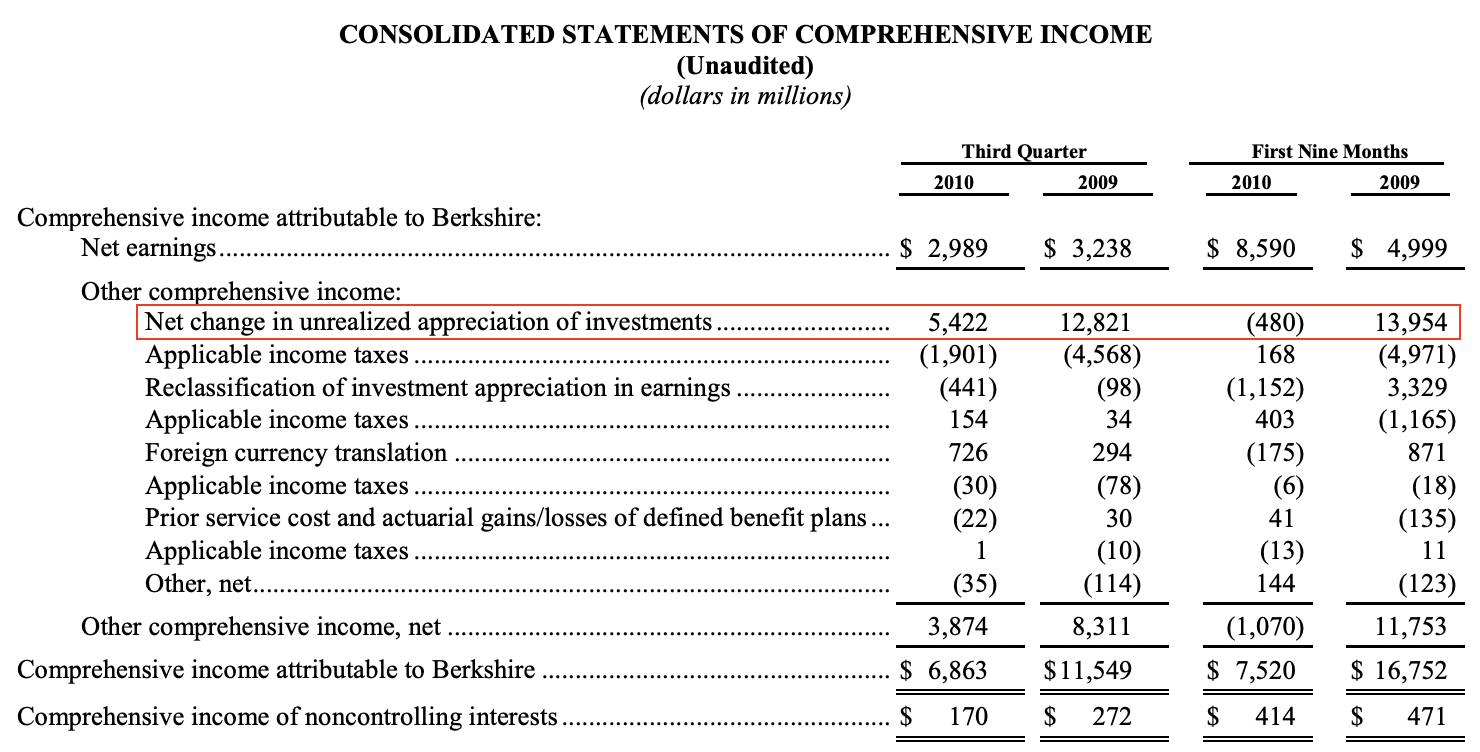
3 Publicly traded C-corps are required to publish a “statement of comprehensive income,” supplementing their “net earnings” statement with revaluation gains/losses plus other, fully explaining their balance sheet changes. Here’s an example from Berkshire Hathaway. It’s a rare household, of course, that assembles anything like this. Even balance sheets are rarely assembled except when applying for a mortgage or financial aid for a child, or when first visiting a retirement/financial advisor. But household heads certainly still maintain a general mental conception of their asset and liability positions.
4 That plural “savings” usage is in the vernacular sense of “your retirement savings.” It’s a stock measure, vs. Saving which is a flow measure. There is no such stock measure, labeled “savings,” in any U.S. national accounts — only assets and net worth.
5 The NIPAs’ accounting identities terminate with its Saving measure, a “dangling” measure: Within the NIPAs, it has no accounting relationship to ∆Assets or ∆NW, because those measures are not tallied therein.
6 A notable exception is Saez and Zucman’s 2019 “Progressive Wealth Taxation.” It employs H-S income throughout, though not by that name. They call it “true economic income,” deployed eight times in the paper. One example, emphasis added: “As long as Bezos, Buffett, and Zuckerberg do not sell their stock, their realized income is going to be minuscule relative to their wealth and true economic income.”
7 Godley and Lavoie stand out for incorporating holding gains in more advanced models in Monetary Economics, and taking H-S income seriously right from the get-go and throughout.
Worth repeating: ““The greatest trick capital-gains income ever managed was convincing the world that it doesn’t exist.” And yet you would think that cheerleaders of capitalism would trumpet the financial performance of capitalism. After all, isn’t that the only thing that matters?
Of course, that’s not all that gets ignored. Also rarely mentioned is the staggering rise of profitability, which was only 2% in the 1960s and 1970s and is now close to 18%. Profit per unit of real gross value added of nonfinancial corporate business: Corporate profits after tax with IVA and CCAdj (unit profits from current production) (A466RD3Q052SBEA) | FRED | St. Louis Fed
And then there is the matter of rising income inequality even ignoring unrealized capital gains. Despite a flurry of attention in the 2010s by Piketty, Saez, Zucman and company accompanied by ritual talking points by politicians, it is hardly part of either mainstream economics or of political discourse.
Worse yet, if inequality does get discussed, the collateral damage it causes mostly manages to avoid discussion with some exceptions: INET Warned Over 2 Years Ago: Spending by the Wealthy Is Distorting the Economy | Institute for New Economic Thinking “The idea is finally catching on, but many still miss how deeply it’s driving inflation, masking wage losses, and complicating recovery.”
With inequality being the elephant in the room, you have to ask why more economists and politicians don’t focus on it. I mean, who benefits from their inattention?