BOND YIELDS AND MONETARY VELOCITY
I have been monitoring the close relationship between bond yields and monetary velocity ( personal income/zero maturity money) for years without coming to strong conclusion about what to make of it. In particular, it displays the long term secular rise and fall of bond yields before and after 1980..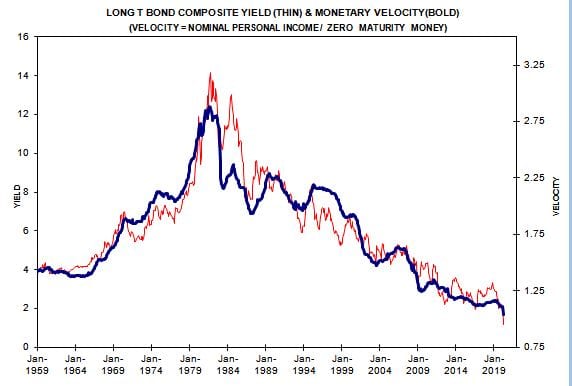
I do not know of any other economic variable that parallels bond yields so tightly for such a long period. OK, first question. Which way does the causal relationship work? Is it rates driving velocity or velocity driving yields? Or is it some other variable driving both? I use to think velocity was a function of real interest rates. At least that was consistent with the monetarist school of economic thought, especially in explaining the 1930s depression. But now we are back to negative real interest rates and it does not yet appear to impact this relationship. If we are at a long term secular bottom in yields I would expect to see monetary velocity start to rise. But it has not happened yet. But now that we are back to uncharted waters, I would be interested in hearing what others have to say about velocity and bond yield
MV is just a ratio. GDP/ Money supply. The calculation is done using #s that are old. I don’t see it as a predictor of anything.
When the Fed buys securities (QE) it expands the money supply. So MV automatically falls. When the Fed does QE it drives interest rates down. So that is the connection for the correlation. The FED controls interest rates and money supply. Measures of Interest rates (Tbond yields) and money supply have to run together.
There may come a day when when the relationship is broken. That would be messy. That would mean the Fed is no longer in control. I don’t see that happening.
Trade deficit started to grow when velocity shrank. We rely more on foreign manufacturing. Special cause was low cost goods from China which really got going in 1985.
So velocity fell since we did fewer things, but then the question is why does China now accept such low rates on T bonds? Prior to 2001 we were willing to pay 5% or more on T bonds. After 2009 we were willing to pay 2.2% or so. It seems that China has to answer the question about what is their limit.
The asset debt macroeconomic system is deterministic. The fractal growth and decay composite equity and CRB valuation cycles are fractally quantitative. The two basic fractal patterns are x/2-2.5x/2-2.5x/1.5-1.6y and y/2-2.5y/1.5-2.5y. This simple self- assembly mathematical pattern confers on the asset debt system macroeconomic system the quality of a science. The second sub fractal cycle series determines the ideal base first fractal length. The US third fractal starting in 1932 is composed of two fractal series: 10-11/21-22/21-22 years (y/2y/2y) ending in 1982 and 9/20/12 of 12 years y/2-2.5y/1.5y years ending in 2020. Global central banks must print money; the other choice is a 1930’s deflationary depression which is politically and social unacceptable and not a choice. This money creation will not result in an inflationary scenario. Too much private money is owed. Sufficient money will be created and added to kept the system solvent. With an initiating fractal of 18 years in 1790 near the inception of the US constitution, the subsequent 1807 x/2.5x/2.5x/1.5y US hegemonic fractal series is 36/90/89/54 years ending in 2073. See if you can determine the daily fractal series since the March 2020 low. Hint: a major trading low will occur in three more trading days. Bad (but expected) data came out today. Will the low in three trading days be a function of the bad data or a function of the mechanistic trading high and low saturation self assembly nature of the global macroeconomic asset debt system?