This comes from the Philly Fed’s state-by-state coincident index, via Bill McBride. The graph below shows the number of states showing increasing economic activity:
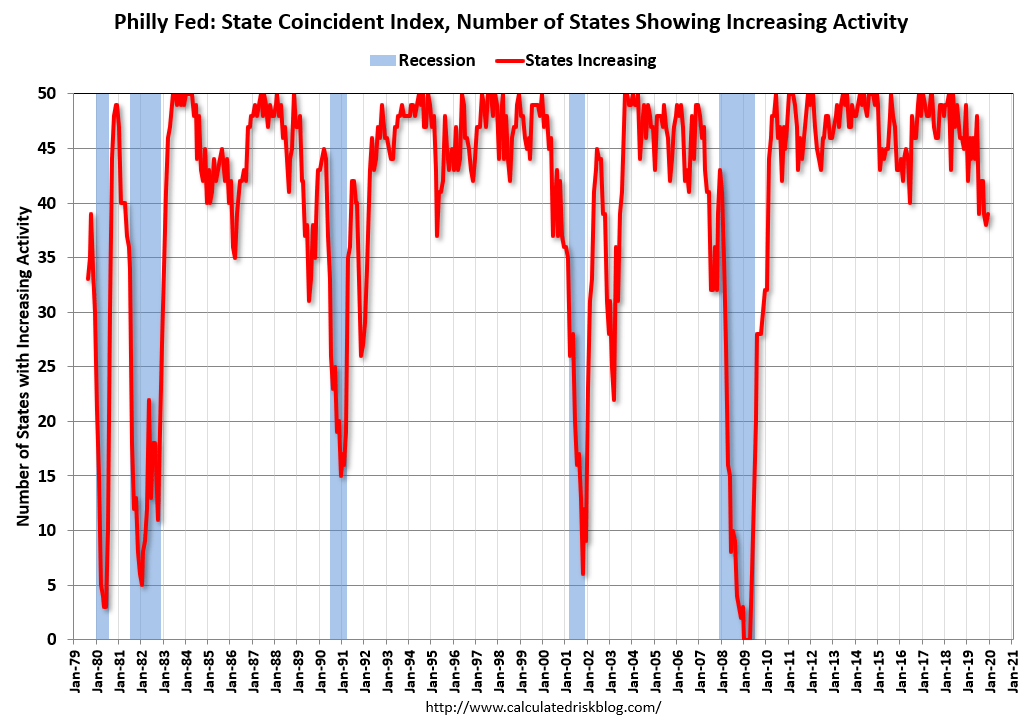
In December the number of states in expansion was 39. Historically over the past 40 years, that number dropping to 35 or below has (with the exception of one month in 1986) been the marker of the onset of a recession.
Note the number is below the lowest level from 2015-16, in which weakness was generally confined to the Oil patch. It is yet another marker of a slowdown, but not of a recession.
Later this morning we’ll get the January ISM manufacturing report, and over the next 48 hours we’ll get reports on January auto and truck sales. Both of these will help tell us if the weakness in the production sector has been spreading or not.
If I see it properly there is one more counterexample for 39 (in 96). But there is no example of it being this low in late expansion where it has not led to a recession. The current situation looks more like ’91 than any other time I see. The ’91 recession followed the dot com stock market collapse. How extended is the stock market looking these days?
Oops – my memory was incorrect, it was not the dot com bubble burst in 91. I remember that recession well as it caused me to leave the UK for Germany. It was fairly hard in the UK. Googling, I don’t see a particular cause of it. There was some financial instability in Asia, and it came about the same time as the collapse of the iron curtain and Chinese economic opening. And just after the first Iraq war. Don’t really know why the charts look so similar.
I generally ignore this index. It’s revised heavily. I generally like markit PMI the best in terms of a overall economy snapshot.