Have we finally reached “full employment”?
Have we finally reached “full employment”?
As I noted on Friday, the household report – the one that tells us about unemployment, underemployment, and labor force participation – was particularly good. In fact, the last two months together have been so good that, at least by some measures, we may finally have arrived at “full employment.”
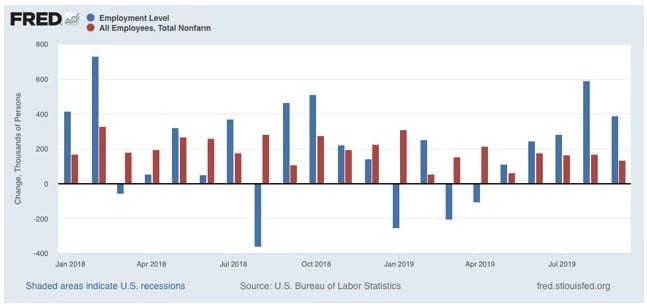
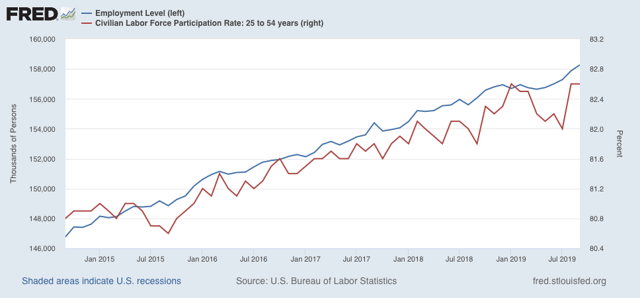
Let’s start with the basics. Gains in employment as measured by the household survey (blue in the graphs below), as opposed to the larger (and, yes, more reliable) payrolls survey (red), were 590,000 and 391,000 in the last two months, respectively. Those were the biggest gains in nearly a year:
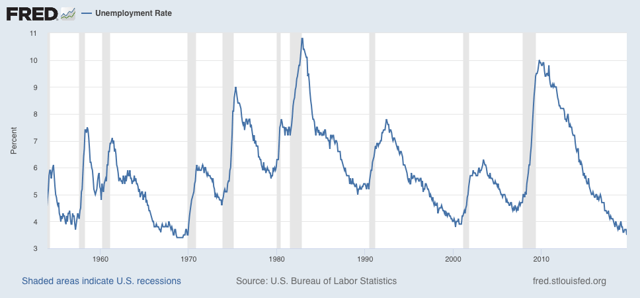
At 3.5%, that gave us the lowest unemployment rate in the past 65 years (except for a few months in 1968-69):
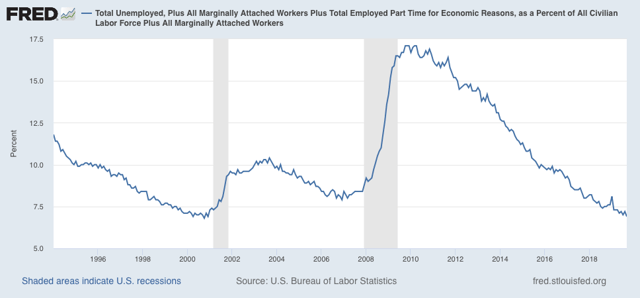
The U6 underemployment rate is also at its lowest level, save for one month, since the series began in 1994:
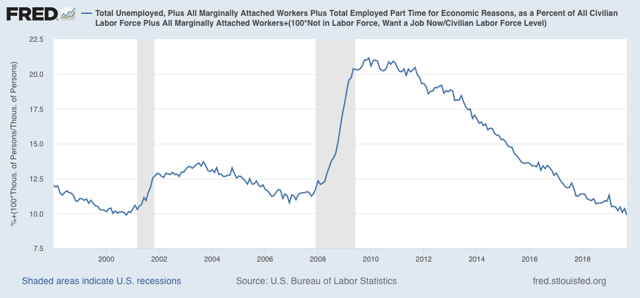
And even beyond that, when we add in those who aren’t even in the labor force, but say they want a job now, we are at the lowest level of all:
By all of the above measures, it certainly looks like we have finally reached “full employment.”
Further, participation in the labor force in the prime age group (red in the graph below) jumped by +0.6% from July, tying its highest rate of this expansion, at 82.6%:
In the below graph, both prime age labor force participation, and the prime age employment-population ratio of 80.1% are normed at the zero level, to show how the present level compares with earlier expansions (prior to 1987, the levels were never as high as presently):
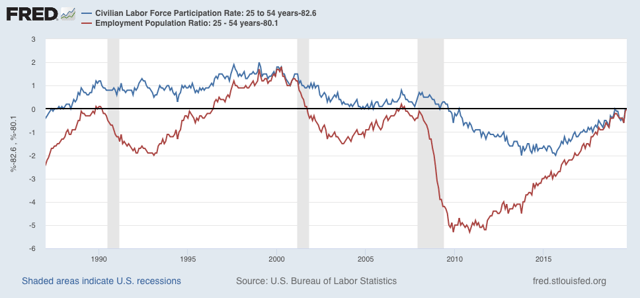
Prime age EPOP is within 0.2% of its highest level in both the 1980s and 2000s expansions. During the boom of the late 1990s, both were significantly higher. Only by that measure are we not now at “full employment.”
The late 1990s was the one time since the 1960s that real wage growth really boomed. I suspect real wages are the reason for both the recent improvement (due to big minimum wage increases in a number of states) and also why participation still lags the 1990s (because real wages haven’t improved enough to lure enough people out of continuing education, or to alter the trade-off of the cost of child care for others).
In summary, I think there is a good argument that we have reached “full employment,” but not “booming employment,” because wage growth is still tepid.
“In the below graph, both prime age labor force participation, and the prime age employment-population ratio of 80.1% are normed at the zero level, to show how the present level compares with earlier expansions (prior to 1987, the levels were never as high as presently):”
WHAT???? The current prime age EP ratio does equal 80.1% which your graph shows to be below some “normed at the zero level” but you have not told us how you have defined this norm. Please do.
A bit of an aside:
Employment Population Ratio: 25 – 54 years (LNS12300060)
Civilian Labor Force Participation Rate: 25 to 54 years (LNS11300060)
These two series are offset by 2 or 3 percent with even more during the recoveries. The latter comes from the Household Survey. The difference is not just sample size and volatility. How should I interpret that?
“Employment Population Ratio: 25 – 54 years (LNS12300060)
Civilian Labor Force Participation Rate: 25 to 54 years (LNS11300060)
These two series are offset by 2 or 3 percent with even more during the recoveries.”
Let’s label the first EP. Let’s label the 2nd LF. Recall how the unemployment rate is defined:
(LF – EP)/LF.
Unless the unemployment rate is zero, LF will be above EP.
Thank you for overcoming that silly mental block.
So if the economy is underdamped, we will overshoot full employment, If underdamped (and a soft landing is possible) we will approach asymptotically. With the actual variability and flows from the underlying population growth, it won’t really be that simple to see in real data.
Still, I have to ask if recessions are largely an artifact of firms over-reacting to seeing evidence that the economy is underdamped.
Nope, we are not. Nonsup wages would be in the 3.7+ ranges. The Boomer withdrawal coupled with only .5+ growth above trend has put them on disability while they still look for work at wages too low for them in a large bunch to even bother with. LFPR should have a 64.5% peak potential……we are not close to that. 20 years ago you had a much smaller cohort retiring coupled with stronger growth meant a higher unemployment rate.
I think the useries this cycle has been disaster due to these disability persons who are still looking for work not being counted.
“LFPR should have a 64.5% peak potential”
Bert? Bert? Labor force participation was 67.3% in early 2000. It currently is 63.2%.
https://fred.stlouisfed.org/series/CIVPART
Damn – I guess you do not know the difference between the employment to population ratio and the labor force participation rate. BTW – ever heard of DEMOGRAPHICS. Maybe a 61% employment to population ratio is a bit below full employment but only the dumbest person on the planet would suggest we should be back to 64.5%.
pgl:
Yeppers, PR did hit 67.3 Jan- April 2000 and 67.1/67.2 Jan.- Mar 2001 Historical PR We were kind of hyper-ventilating back then. Greenspan took the Fed Rate up to 6.5% March of 2000 and then took it down 10 1.75% 2001. By then we had slipped into recession or what NDD has termed a manufacturing recession. Fed Target Rates
It is hard to match PR in 2000 and PR 2019 as they have different age ranges for both time periods. If we were to match 2000 to 2019, perhaps count people from 16 – 65 and stop at that range.
pgl, its all about “potential” LFPR, not “where it was with some census pop in 99-00”.
Lets remember, the Boomers are going going and in 5 years, gone in terms of impact on data. You can’t have the same potential height in 2000 in 2020. Its where “potential” LFPR is and due to it now not rising since 2013 in the manner, you would expect, its led to a distorted u-series and overly low unemployment compared to whats expected under “full employment”.
“potential” LFPR? Come on Bert. Back in 2006 Brad DeLong noted a post I wrote on the employment to population ratio (EP) which is NOT LFPR (as I noted earlier so could you learn to READ). I made the case that the full employment EP should be 64% back then which Brad loved and dubbed my idea as the natural rate of EP.
But if you had an ounce of brains and actually read anything on this topic over the past 13 years, you would realize that this natural rate of EP is now at best 62%. Something called DEMOGRAPHICS which I just noted.
Bert – seriously. Do you know how to even read basic English? Geesh!
“You can’t have the same potential height in 2000 in 2020.”
OMG – this comment from Bert contradicts the mess out of the original comment from Bert. I guess there are two Berts – both of which has no clue what the other one is writing!
PGL:
We work with him. Bert is a project and I think he will pick up from us greater knowledge unlike some at Economists View.
Considering I have actually worked in the government with stats unlike any of you. I should be educating you.
US population growth has weakened considerably since 1999. That is a fact. Your not going to have the same heights in labor force participation you had in 2000. Pure and simple.
Look at Japan, its unemployment is 2.4%. Why is that? Mercy people, respect the demo. My bet full employment is 2-3% now rather than the 4-5% it was in the post-war era and into the late 20th century tech boom.
Now think about that for a sec………………