Real Per Capita Income by State ( 2012 $ ) Updated
You can not use inflation data like the CPI to compare living cost is one location to another. So the BEA has constructed a database of Regional Price Parities ( RPP) that allow you do do that for all states and the some 383 Standard Metropolitan Areas in the USA. I was preparing to show them when BEA published the 2018 data. But that data will not be released until next year so I’m going ahead and showing the 2008 to 2017 data. Note, that in the tables for real per capita personal income by state for 2012 and 2017, I have converted the data in 2012 $ to an index of personal income as a percent of the national average to facilitate comparisons.
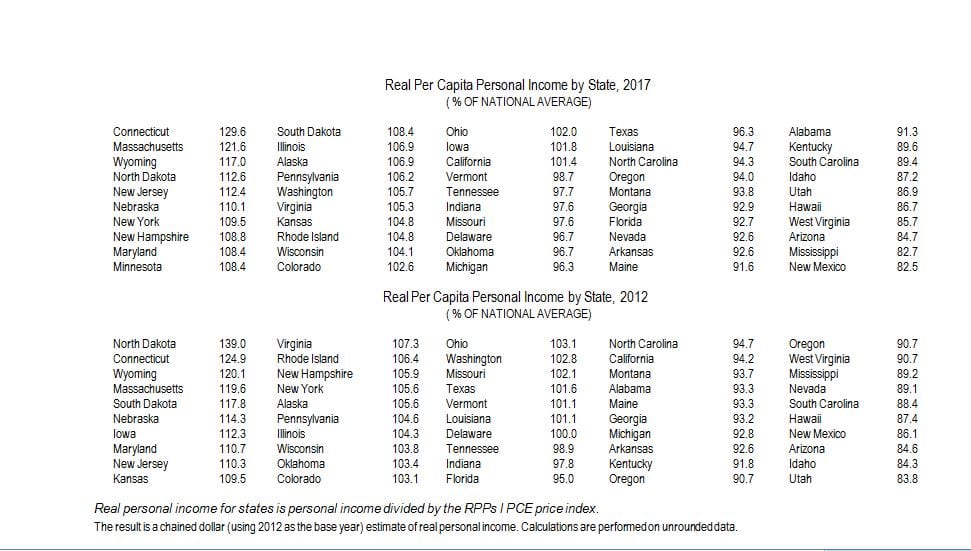 Figure one
The first thing I noticed in the data is Connecticut and Massachusetts at the top of the tables with per capita real incomes of 129.6% and 121.6% of the national average, respectively.
Even adjusted for the high cost of living they still have the highest real per capita income in the US. I’ve long thought of these two states as prime examples of the post-industrial economy.They were the first industrial states and went through major problems when the textile and shoe industries departed for cheap labor in the south — something quite like the rust-belt states are now experiencing. But that was decades ago and they have now developed economies based on education, finance, high technology and medical care. The basis for each was the state investing strongly in education throughout the decline of the old industries so that they had the trained labor force to take advantage of new opportunities.
Interestingly, we still hear the old arguments that cheap labor is the way to go. The old Confederate states are prime examples of where basing you economy on cheap labor gets you. Only one of the Confederate states, Virginia has above average real per capita personal income. A second,Tennessee has about average real per capita personal income. But the remaining 8 are all mired in the bottom two quintiles of income. American firms that moved their plants to the south are now looking for skilled labor without much success. If you go to Mississippi for cheap labor you have to realize that there are reasons the labor is cheap. If you use Mississippi labor you are also going to be stuck with the Mississippi education system.
The next thing that jumped out of the data is how California and Texas swapped places from 2012 to 2017. In 2012 Texas real per capita income was 101.6% of the national average while California was 94.2%. By 2017 Texas had slipped to 96.3% while California rose to 101.4% of the national average. For years we have heard Republicans and right wing pundits calling California economic policies a disaster and praising the Texas model. One wonders if they ever mark their models to the market as the market clearly contradicts their claims. Of course, we will not say anything to them about New York and New Jersey being in the top quintile.
One other thing you can do with this data is compare the economic data in the states that voted for Trump to those that voted for Clinton. From 2008 to 2017 real national per capita personal income averaged $44,982 (2002 $). In the states that voted for Trump the average was $44,288 and in the states Clinton won it averaged $47,000 ( 2012 $). Not only was income 5.8% lower in the Trump states but growth was also slower. In the 4 years leading up to the 2016 election, real per capita personal income rose 4.9% in the Trump states while it rose 7.7% in the Clinton states.
The image is very poor.
You should start with a PDF and then export a 600dpi PNG, insert it and use scaling in HTML to shrink it to size.
The chart is a little more readable now
Dan:
Thanks.
Spencer:
Do you have this on an Excel spreadsheet? I would like to use it in Michigan. In its present format, it is difficult to read. The info is very helpful.
I believe adjustment for tax differences are missing. That would include adjustments for income, real estate and sales taxes. A $1 million dollar home in NY, NJ run at the $50k level. The same house in Alabama, for example might be $5k.
The comparisons include home owners equivalent rent which is the single most important reason for the large differences.
Spencer:
I shot you an email. You have two Oregons in the 2012 data and you are missing Minnesota there also. It is readable now.
i hate this kind of thing because it looks like it might be saying something interesting, maybe even important, but i don’t have time to analyze it carefully enough to tell if it is saying anything meaningful.
for what it’s worth i lived in massachusetts for a while, and i live in oregon for now. quality of life in oregon is so much better than in massachusetts
that i suspect relative average real income is not a good basis for policy decisions.
nor am i quite so certain “good education” is a good thing. maybe for much the same reason: “good education” seems to mean “how to succeed in business without really thinking.”
but don’t get me wrong. i am not in favor of ignorance or poverty.