The Phillips Curve is Alive and Well and Living in Europe
What happened to the European Phillips Curve ?
Recently many have argued that the Phillips curve has become the Phillips horizontal line. I am old enough to remember when the hot new idea in macroeconomics was that the long run Phillips curve is vertical so inflation varies but unemployment stays near the natural rate and average unemployment over medium long periods is constant. Oddly, this view is still the basis of policymaking including notably the European Central Bank’s single mandate to seek price stability and let unemployment handle itself. It also means that the standard ad hoc empirical Phillips curve shows the acceleration of inflation as a function of unemployment.
But now, the problem with the Phillips curve is supposed to be that it is flat. I know of quite a lot of work with US data which supports this view. A good place to start is with Olivier pdf warning Blanchard
The Economist has a blog post on the issue. They look at average core inflation and an estimate of average cyclical unemployment over advanced countries. They find that the slope of the curve has declined and was almost exactly zero from 1995 through 2013.
I decided to look at the 15 Countries which were in the European Union in 1997 (because I have data from DG EcFin). I prefer to look at wage inflation first (that’s what Phillips did & it most nearly makes sense). I took the simple average across the 15 countries (so Luxembourg counts as much as Germany) to see if the curve has become horizontal
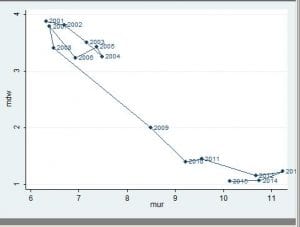
mdw is wage inflation averaged over the 15 countries. mur is the average unemployment rate. That sure looks downward sloping to me. So how can it be that the Phillips curve has been declared dead ?
After the jump, I try to answer that question. I also posted an 8 page pdf here.
Briefly, I think the answer is that the very clear relationship, which is the same as the one noted by Phillips in 1958, has been obscured because of two choices made to respond to theoretical critiques of the orginally observed fact (and the choice to make facts bow to theory). First decades ago it was assumed that any relationship should be between unemployment and the acceleration of inflation not the level of inflation. Second, the high persistence of unemployment was assumed to be due to structural problems, so the natural rate of unemployment was assumed to vary and the acceleration of wage inflation depended on raw unemployment minus this variable natural rate. The estimates of the natural rate don’t make sense, and subtracting one of those silly series obscures the simple pattern in the raw data.
It is true that if one zooms out and looks at a longer time interval, the slope of the EU15 average crude phillips curve has declined.
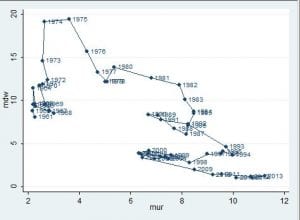
However, it is reasonably obvious that this is the result of leaving out any term for expected inflation. Inflation is highly persistent. My story about the scatter is that persistently high unemployment caused a persistent decline in actual and expected inflation. The brief periods of not extremely high unemployment didn’t cause inflation to increase because unemployment was still greater than the natural rate.
Another way of putting this is that inflation trended down and unemployment trended up over decades, so the scatter is regressing one trend on another. This is called a spurious regression.
I think the extremely simple pattern (which would surprise Phillips not at all) has been obscured by subtracting nonsensical estimates of the natural rate. A pattern which is clearly there in the raw data is not there in the processed data, because the data is processed based on theory which is based on false assumptions. The long dominant natural rate hypothesis, and additional assumptions about the uniqueness of steady states and convergence to those steady states, has caused many economists to assume that cyclical unemployment looks as they think a cycle should — that it averages roughly zero over periods longer than a decade and that the half life of deviations from zero is on the order of a few years. Persistently high unemployment was assumed to be structural — due to fluctuations in the natural rate. I think this has been an article of faith unsupported by the data and challenged by data for the past 32 years at least.
I objected to the graph in the economist because they look at the level of inflation and not inflation minus expected inflation, but I think the more common problem is insisting on looking at the acceleration of inflation. A main point of the linked Blanchard pdf is criticism of this assumption. When setting monetary policy, central bankers consider the possibility that inflation expectations are anchored. For some reason low-brow applied work sticks with an accelerationist Phillips curve. Academic macro doesn’t and actual monetary policy making doesn’t, but something in between does (something like articles in The Economist, but also commentary by academic economists).
So I see two mistakes obscuring the still existing Phillips curve. The first is estimates of the natural rate of unemployment based on the assumption that deviations from the natural rate are small and don’t last. The second is imposing the assumption that once lagged inflation affects current inflation one for one.
Now I will start estimating regressions.
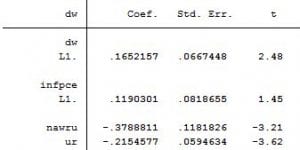
Table 1
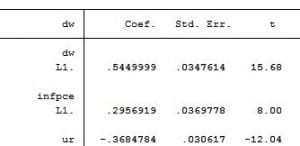
Legend: dw is wage inflation, infpce is personal consumption deflator inflation. ur is the unemployment rate. L1 means lagged once. The data are annual from 1962 through 2015 for the 15 countries. The regression also includes country dummies.
Table 1 is the basic regression. It shows some anchoring — the sum of the coefficients on lagged wage inflation and lagged price inflation is roughly 0.84 significantly less than 1. The coefficient on the raw unemployment rate is dramatically statistically significant.
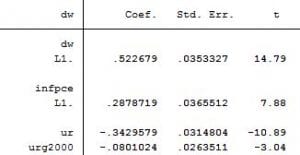
Now has this relatinship vanished in the 21st century. Table 2 is the same regression with the sample 2001-2015
Table 2
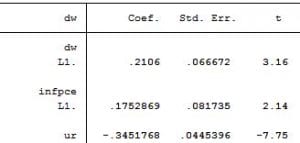
legend: The data are annual from 2001 through 2015 for the 15 countries. The regression also includes country dummies.
There has been a dramatic change all right. The coefficient on unemployment is almost identical, but in this century, the evidence of anchoring is as massive as an anchor. Blanchard stresses that the same pattern appears in the USA (Krugman (of course) also noted this as did your’s truly ).
How has the Phillips curve been declared dead, when the simple crude regressions I present don’t even suggest it has a cold ? I think the problem is that it was critiqued and improved until we arrived at a model which is easy to reconcile with the assumption that people are rational but has no connection with reality.
Table 3 shows the simplest possible accelerationist Phillips curve estimated with 21st century data
Table 3
![]()
legend: ddw is the change in wage inflation. The regression includes country dummies. It uses data from 2001 through 2015
If one insists that once lagged inflation must have coefficient 1 , then one finds no Phillips relationship at all. The regression implies almost no ability at all to forecast the acceleration of inflation in the 21st century (the R squared is less than 1%). It is an utter failure.
I will return to regressions of wage inflation on lagged inflation and the unemployment variable, that is, from now on, I will allow expectations to be anchored.
All regressions so far rely on the assumption that the natural rate of unemployment is constant. The country dummies correspond to different natural rates in different countries, but it is just assumed that the natural rate doesn’t change. This has been considered pathetically crude for 30 years. It has been argued that the natural rate fluctuates (and would be reduced by pro-market structural reform). In practice, the IMF, OECD and EC DG EcFin estimate variable natural rates without insisting that the estimated changes are explained by the structural factors which they insist are important. They use state space models in which the natural rate is an unobserved state which can be estimated using data on inflation, unemployment, and (usually) other variables. In practice, the estimated natural rates look a whole lot like smoothed unemployment. They imply small moderately high frequency fluctuations of estimated cyclical unemployment. The argument is that subtraction of a variable natural rate is necessary, because otherwise there are unexplained shifts in the Phillips relationship. Note that comparison of the crude regressions for 21st century data and pooled 21st and 20th century data provides no support for this claim.
In any case, Table 4 adds DG EcFin’s estimate of the natural rate which they call the non accelerating wage inflation rate of unemployment (NAWRU). It should have a positive coefficient equal to the absolute value of the coefficient on raw unemployment.
Table 4
legend: The regression includes country dummies. It uses data from 2001 through 2015. nawru is the DG EcFin Output Gap Working Group estimate of the non accelerating inflation rate of unemployment.
This is a total disaster. The coefficient on NAWRU is significant and has the wrong sign. There is only limited evidence that this estimate of non accelerating wage inflation unemployment has a different relationship with wage inflation than raw unemployment does.
This failure of the NAWRU to help explain wage inflation is not just a 21st century problem. It also fails (not quite so spectacularly) when included with raw unemployment when data from 1962 through 2015 are used as shown by Marco Fioramanti and me.
I should stop, but I want to see if I can create the illusion of a vanishing Phillips curve. First I impose the same coefficients on lagged inflation for both centuries. The variable urg2000 is the unemployment rate multiplied by an indicator for years after 2000.
Table 5
legend: The regression includes country dummies. It uses data from 1962 through 2015. urg2000 is unemployment times an indicator of years after 2000.
There is no sign at all of a reduced effect of unemployment on wage inflation. The sign of the coefficient on the interaction term implies a greater magnitude of the effect in the 21st than in the 20th century.
Finally I look at DG EcFin’s estimate of cyclical unemployment ur_cyc_nawru which is raw unemployment minus their estimate of the NAWRU
Table 6
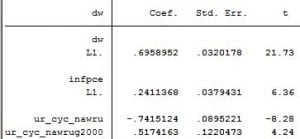
legend: The regression includes country dummies. It uses data from 1962 through 2015. ur_cyc_nawrug2000 is the DG EcFin estimate of cyclical unemployment times an indicator of years after 2000.
Here the apparent change in the relationship finally has the sign corresponding to the laments about the deceased Phillips curve. The coefficient on the interaction term corresponds to a dramatically reduced relationship between cyclical unemployment and wage inflation. However, the results with raw unemployment demonstrate that this is the result of a change in the relationship between estimated NAWRU and the natural rate of unemployment relevant to the Phillips curve. There is no problem raised by the raw data, no puzzle to be solved. The puzzle is created by the proposed solution to a problem which was assumed to exist.
It should be noted that NAWRU estimation is based on many assumptions and that just one of them is that the relationship between cyclical unemployment and wage inflation does not change over time. Table 9 is further evidence that the calculations are based on incorrect assumptions and a misspecified model. Even if raw unemployment isn’t considered and it is simply assumed that the correct variable is the DG EcFin estimate of cyclical unemployment, the significant coefficient on the interaction with the dummy for the 21st century shows that there is something very wrong with the estimats of NAWRU.
Conclusion
There is nothing at all the matter with the Phillips curve. Specifications used in the 1960s work fine in the 2010s. The problem is created by efforts to solve earlier perceived problems. It was not considered acceptable to model anchored inflation expectations and it was assumed that business cycles are small and brief. There was never any good reason to impose these assumptions. The data from this century make them almost indefensible.
The first curve posted looks like unemployment and inflation bunch up in two corners of the graph and jump between states in one year. In what year did the unemployment market switch between the two states? Why 2009, the crash. In that move we switched from full employment to full employment, faster than anyone in central banking could react.