Scenes from the September jobs report
Scenes from the September jobs report
On Friday I highlighted the difference between the results of the establishment survey and the household survey. A 2006 paper from the BLS (pdf) explaining the differences in how jobs are counted in the two surveys shows us why:
Interviewers from the Census Bureau contact households and ask questions regarding the labor force status of members of the household during the calendar week that includes the 12th day of the month. The broad coverage of the CPS encompasses … workers temporarily absent from work without pay.
….
[In the Establishment survey, b]usinesses report the number of persons on their payrolls who received pay during the pay period that includes the 12th day of the month. Workers who did not receive pay during the pay period are not counted.
Thus, although the household survey is the smaller sample, and thus subject to much more noise, it probably gave us a much truer picture of the labor market for the whole of September. While the employment gain itself (906 thousand!) was insane, and surely not accurate, the ratios of unemployment, underemployment, and participation in the survey probably picked up the true trend of improvement.
So let’s look at those. First of all, here is the U6 underemployment rate. I’ve subtracted 8.3% from the result, to better show how the present situation compares to the last two expansions:
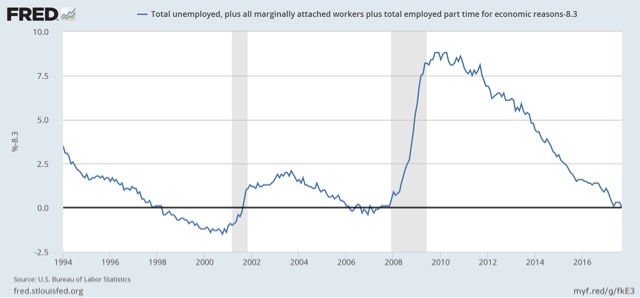
In the last expansion, the underemployment rate newer got below 7.9%. The late 1990s was a genuine boom.
Next, here is the employment to population ratio for the prime age workforce of 25 to 54:
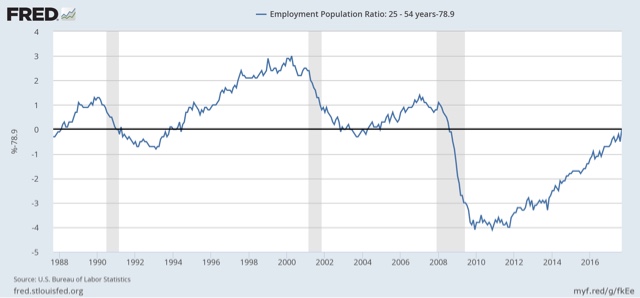
We are 1.3% below the peak of the last expansion. Again, the figure for the 1990s shows what a real boom looks like. Since that demographic is about 125 million people, that 1.3% equates to a little over 1.6 million people.
So if we were to get another 1.6 million jobs over and above population growth, plus growth of about 400,000 full time jobs vs. part time jobs to convert the involuntarily part time employed, that would get us to full employment.
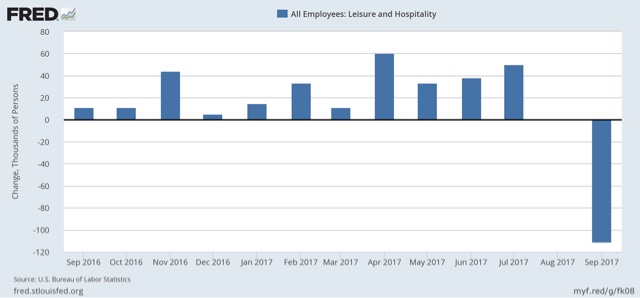
No, the NFP would have been about 200,000+. Not 105,000. That sector probably would have added 130,000k, you ignore the rest of the sectors added 85k without anymore Houston area in those sectors either. September is usually a bullish BLS month and it was no exception this year.