Is there a natural rate of inflation?
In a previous post, I wrote about a natural rate of inflation. Does it really exist? What would it look like?
We could understand a natural rate of inflation as the inflation rate at which the economy can most efficiently progress in terms of social benefits and costs. Some benefits are more employment, greater growth of GDP and lessening the burden of debt. Some costs are wealth reduction, business uncertainty and more price distortions.
How could we determine a natural rate of unemployment?
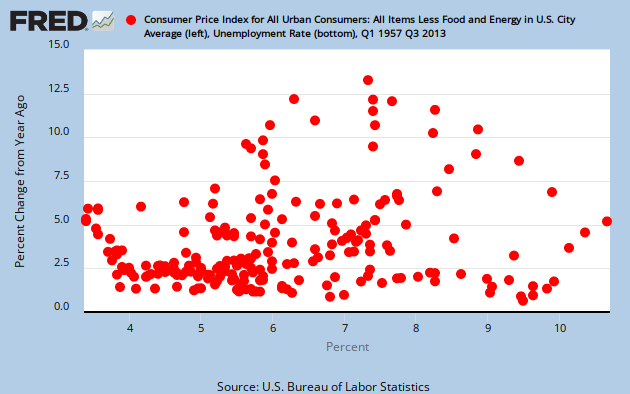
One way is to plot inflation (CPI, less food and energy) against unemployment. The cycle between these two variables is that as GDP is growing, inflation stays steady and unemployment is coming down. When GDP hits its natural rate at the LRAS curve, unemployment stops declining and inflation starts rising. The plot moves generally in a clockwise manner. However, since 1989, when unemployment stops declining and inflation doesn’t rise much at all. So in the following graph, we identify the points where unemployment stops.

Link to graph: Plotting natural rate of unemployment with inflation. (Fred graph with data for 1957 to 2013.)
The graph is a scatter plot of unemployment and inflation (quarterly) from 1967 to 2013. The red dots mark the points where unemployment was when GDP hit its natural level. (See the arrows showing direction of movement in 1978.) Thus, the red dots mark the natural rate of unemployment. I included 2 points earlier than 1967. Roughly speaking the black line connects the red dots to show if there is a connection between the natural rate of unemployment and an inflation rate.
The 7 points that we have before 2013 stay fairly close to the black line. What do we see? When inflation is lower than 3%, the natural rate of unemployment stays below 5%. If inflation goes over 3%, the natural rate of unemployment stays above 5%.
Thus we might hypothesize a couple of alternatives…
- that as inflation rises over 3%, the natural rate of unemployment tends to rise too.
- that 2% is the natural rate since most red dots occur there.
- that any relationship here is simply coincidental.
I assumed in the previous post that as inflation dropped below a certain level that the natural rate of unemployment would rise. The graph is showing the opposite of what I assumed and what I understood from a quote by Joseph Stiglitz.
So now look at the red dot labeled “Currently projected”. This is where I project the next red dot. Real GDP will meet its natural level at an unemployment rate of 7%. Most economists assume that unemployment will simply head back to where the rest of the red dots are. The difference is that I see the effective demand limit constraining unemployment at 7%, which never happened to the other red dots. The other red dots were always close to the effective demand limit.
Can one conclude from the graph that there is evidence for a natural rate of inflation? Maybe. I will say that the economy seems to gravitate to an inflation rate around 2%. I do not think that Fed monetary policy is totally responsible for that. And having more inflation does not seem to ultimately create more employment. I am left with a sense that a range from 2% to 3% inflation is sufficient for the economy. Above 3% and below 2% does not seem ideal or necessary.
One benefit from having higher inflation now would be that the debt burden would lighten for many who are deleveraging. But inflation is not going to rise to create this benefit. Inflation gets into a rut as it approaches the natural level of real GDP.
To wrap it up… we need some inflation as a shock absorber for adjustments. We need some inflation to complement the momentum of output growth. And I can see why the Fed decides to kill the inflation that can develop at the natural level of GDP. It can be disruptive.
Inflation is not the problem. The real problem with sluggish output growth and high unemployment remains weak liquidity among consumers. And the Fed may think that higher wages will cause inflation, but the evidence shows that higher wages would lead to output growth instead. (source paper for wage-led growth, thanks to Marko in the comments section.)
Edward, I think we need to look at this data a different way, because we know that the current official unemployment numbers are complete BS with the vast number of workers that have fallen off the edge and not been employed in over 2 years. I think a much more interesting graph would plot against the employment to population ratio like http://data.bls.gov/timeseries/LNS12300000 so the real level of labor utilization in the economy is what you are looking at.
WJL,
The normal unemployment rate is still valuable. When you talk about under-employment, the effect of that shows up partly in the capacity utilization rate. We are employing less labor and less capital than before.
But if you apply under-employment to inflation, you get the same message, Inflation is what it is. Markets control prices. Lending aligns itself with the profit projections. Business investment aligns itself with the profit projections. The profit projections align themselves with inflation. Money in the economy aligns itself with inflation expectations. Prices stabilize the market. and business expansion aligns itself with market prices.
Prices have been pushed low on top of low wages. There is not much profit in raising prices because people don’t have enough liquidity to support higher prices.
Imagine the next recession and unemployment goes to 12%. Will inflation turn to deflation? Only briefly, then it will pop back up. The demographics of the US will not sustain deflation like in Japan.
The under-employment that you are talking about will not change inflation, but it is factor of why it is low.
The economy has real serious problems going forward.
Ed very nice post.
Of course that may be the effect of me actually understanding more of it and also agreeing with its conclusions, like most people I like folk telling me what I want to hear in a form that I at least believe I understand.
If I read this right it seems you are suggesting the data show that a policy of targetting real wage while keeping a vigilant eye out for inflation is the right way around. As opposed to what I see as the standard view over the last few decades of taking every positive metric for real wage as a bright red warning sign of pending inflation. In the end this might just mean some balancing of Fed policy at the margins, but after the experience of my entire lifetime even a hint of ‘leaning in’ in the direction of encouraging employment AND real wage would be a welcome thing indeed coming from the monetary folk.
That is NAIRU should be an empirical measure subject to adjustment by actual data and not the strait-jacket it seems to have been in both theory and subsequent policy in the past. For example I am fully willing to concede that official unemployment at 3% is well below anyone’s idea of a ‘natural rate’. But not thereby just willing to chuck 4% and 4.5% over the rail as dangerously inflationary. Not without data anyway.
So thanks. I think.
Bruce,
I agree with you. No need to be so fearful of a rise in real wages. Inflation mostly happens at the NAIRU. But inflation does not have the same dynamic as decades ago when there were all kinds of investments flying around. Now the investments are much more “within house”. I mean within firms that have been in business for a longer period of time. Decades ago there was more risk taken in business. This created more money for inflation pressures. That isn’t happening now.
The problem with this analysis is that it does not factor in labour productivity. Increasing productivity is deflationary, in that more goods produced (outputs) with the same or fewer resources (labour, energy and capital) increases the purchasing power of constant incomes. That is, wages can stagnate and prices can deflate. This is not a monetary effect, and so the central bank has no control over it. The other point is that rising productivity also produces rising unemployment. Lowering the cost of money has no effect on unemployment when it is rising because of improvements to labour productivity, but it DOES have an effect on private debt levels, as people take advantage of cheap money to supplement falling incomes. There is nothing the government or central bank can do about this. Normal monetary response will exacerbate the problem.
Bruce and Edward,
Take a look at the late Bill Vickrey’s fallacy #6 with regard to the NAIRU. It’s worth a look. I think. http://www.columbia.edu/dlc/wp/econ/vickrey.html
o2sd,
You are right.
The thing is… productivity has stopped increasing. It has been flat for 3 years. Now if it starts to increase, then what you say will start to occur.
Nanute,
I agree with what Bill Vickrey wrote that unemployment can be as low as 2% and still not cause inflation. The key element is where the effective demand limit upon employment is. That is what my research is based on. So in the case of Germany in 1960, when they had unemployment below 1% for a number of years, their economy was very near the effective demand limit. Their incredible real GDP growth from 1950 onwards soaked up the extra dollars entering the economy and kept prices from getting out of control.
Consider this idea… It may be that Inflation is mostly a product of the acceleration and deceleration in real GDP growth. As real GDP accelerates, inflation is subdued. As real GDP decelerates, inflation rises. We could plot the two together and see what we end up with.