Has America Lost its Drive?
Yesterday, Karl Smith posted on Oil and the Structural Recession. This seems to be one of Karl’s thinking-out-loud posts, with more questions than answers, some convoluted reasoning, and a conclusion that higher gasoline prices are in our future. If I read him right, this will be due to a demand pull.
He included this graph from Calculated Risk.

The number of miles driven tends to flatten during a recession, then recover quickly when the recession is over. At least, that’s the way it used to be. The Miles Driven curve seems to have been losing slope since the late 90’s, and was close to flat-line during the housing bubble last decade, when everyone supposedly felt rich. There has been no recovery after the recent Great Recession, which officially ended 32 months ago.
The same CR post cited above also includes this next graph.

This confirms my eye-ball assessment that the slope in the first graph has been in decline since long before the oil price bubble of recent years.
But here is a contrary development. Calculated Risk also reports that the truck tonnage index is way up for all of 2011, and especially in December, when it posted an all time high.

Truck traffic is way up, but total miles driven, per graph 2, has been mostly in decline for four years.
This suggests that discretionary personal driving has been sharply curtailed. I’m having a hard time coming up with any alternative explanation. Can anybody suggest one?
Just in the last couple of months, it seems that discretionary driving has taken a deep plunge that has not yet shown up in the data posted above. Deliveries to retail gas stations have been slumping for well over a decade, and now have fallen off a cliff. If gasoline delivery is just-in-time, as I believe it is, then deliveries are an excellent proxy for consumption.
By the Way, improved fuel economy cannot account for more than a small fraction of this change. The big improvements in fuel economy happened during the 80’s, when fuel deliveries were in an upswing. Since 1990, fuel economy improvements for the actual fleet on the road have been on the order of 0.5% per year.
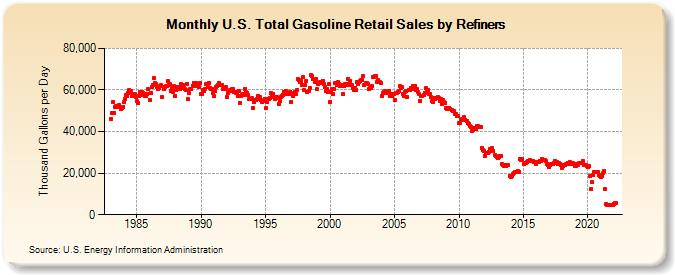
I made my own graphs of the retail delivery data (not posted,) and there is, surprisingly, no particular response to the recessions of 1991 and 2001. It’s not easy to find any recession on Graph 4. Deliveries were slumping even before the Great Recession, so whatever effect it might have had on its own was subsumed by the general trend. The above graph is noisy, due to lack of seasonal adjustment. The lowest row of dots over most of this graph represents January data. Summer months cluster at the top of the array, as you would expect. Those two lonely points in the lower right corner are October and November, 2011, the most recent data shown.
It’s remarkable that gasoline deliveries are now substantially lower than at any time available in this data set. spanning about 30 years. And I would never have guessed that anything like this was happening, based on my many trips on I-75 between Detroit and Toledo. That route must not be a representative sample.
In a comment on Karl’s post, I said that I see all petroleum prices as highly manipulated on the supply side, with demand as a follower. This data makes me think that the same is true of gasoline, in particular. But it can’t be the entire story for the decline in consumption. There is no clear connection between deliveries and gasoline prices over the last several years.
I don’t know where gasoline prices are going. Karl might be right that they are going up. But I don’t see any way that this can be due to a demand pull.
Mish also has a couple of recent posts relevant to this topic.
H/T to commentor rjs at Karl’s post, who got me thinking about this, and provided a key link.
Cross-posted at Retirement Blues.
I’me very skeptical of the retail deliveries data. I suspect something changed about the way EIA collects those data. Although gasoline consumption is clearly down–3 refineries near Philly have closed in the last year, and other refineries have increased product exports, I don’t accept at face value that gasoline deliveries have been cut in half in 6 years. I’ll look around at EIA, and others might wish to do so also.
Here’s a start on what’s going on. We should ignore the Oct and Nov data. EIA says this:
“Notes: Values shown for the current month are preliminary. Values shown for the previous month may be revised to account for late submissions and corrections. Final revisions to monthly and annual values are available upon publication of the Petroleum Marketing Annual. Annual averages that precede the release of the Petroleum Marketing Annual are calculated from monthly data published in the Petroleum Marketing Monthly. Total sales to end users includes sales through retail outlets as well as all direct sales to end users that were not made through company-operated retail outlets, e.g., sales to agricultural customers, commercial sales, and industrial sales. Beginning January 2007, oxygenated gasoline is included in conventional gasoline. In conjunction with this change, total sales for resale has been eliminated to help ensure that sensitive data reported to EIA by individual survey respondents may not be closely estimated using the aggregates published by EIA. Motor gasoline averages and totals prior to October 1993 include leaded gasoline. See Definitions, Sources, and Notes link above for more information on this table.”
http://www.eia.gov/dnav/pet/PET_CONS_REFMG_C_NUS_EPM0_MGALPD_M.htm
Still, even a 1/3 decrease doesn’t seem plausible to me. I’ll keep looking.
Please note that the chart of Gasolne Retail Deliveries is in gallons per day. Converting that to barrels per day (at 42 gal/bbl) means the chart is accounting for about 1,000 BPD, which is just over 10% of EIA reports of total refinery outputs of motor gasoline. Clearly, then this is only some subset of gasoline consumption. I’ve written to the EIA subject matter expert and will tell you what I learn in a followup comment.
Roger –
Excellent. Thank you.
Cheers!
JzB
Roger:
Why would you convert to 42 gal/barrel when Gasoline is somewhat less?
Jazz:
Gasoline refining is also controled with refineries not running near capacaity as they used to early in the last decade and also the last decade. Refining is another cartel
Run75441: By definition 42 US gallons = 1 bbl. http://www.businessdictionary.com/definition/barrel-bbl.html It’s true you can’t equate volume of product output to volume of product input, but it’s pretty close because the products are of lower density. Crude is 7-8 pounds per gallon, but gasoline is only 6 lbs/gal. Also, hydrogen is typicall added; so volume of output can exceed volume of input of heavy crude. Mass of course is conserved.
Roger –
This post might be stale by the time you get an answer. E-mail me and I’ll update in a follow-up post.
[email protected]
i still aint made sense of graph 4, but bill at calculated risk pointed to this article by Brad Plumer at the WaPo in posting about high gas prices last night: Driving, gas prices and the end of retail, which is on a similar theme…
I got rid of my car last summer. I rarely drive, but use ZipCar when I do. The advent of technology and ZipCar is changing things, also people want to return to cities – and this should be encouraged. Zipcar has about 9,000 cars and 650,000 members.