Pharmacy Benefit Managers: The Middlemen Inflating Drug Costs and Squeezing Main Street Pharmacies
There are seventy-one pages to this FTC report. My commentary looks at 5 edited (mine) pages of the report. The intent is to introduce you to Pharmacy Benefit Managers (PBMs) and the control they have over the market. The services they provide has been integrated with the healthcare insurance companies. Which makes this a dynamic dual for prices and profits. More of the information is depicted in the three charts I included below. By no means is this complete. The first chart will provide the linkage between all the players.
It is just too much for me to include the entire commentary in one or even several commentaries. I suggest you do read the complete FTC report. Pay attention to page 71 of the report which is a brief summation.
~~~~~~~~
This Report details how prescription drug middleman profit at the expense of patients by inflating drug costs and squeezing Main Street pharmacies.
Pharmacy Benefit Managers: The Powerful Middlemen Inflating Drug Costs and Squeezing Main Street Pharmacies, Federal Trade Commission
Over the past 20 years, pharmacy benefit services have become increasingly concentrated. In 2004, the top three PBMs served a combined 190 million people and managed 52 percent of prescription drug claims. Today, the top three PBMs—CVS Caremark, Express Scripts, and OptumRx (together, the “Big 3”) manage 79 percent of prescription drug claims for approximately 270 million people. The next three largest PBMs—Humana Pharmacy Solutions, MedImpact, and Prime plus the previous 3 PBMs (the “Big 6”) now manage 94 percent of prescription drug claims in the United States.
Additionally with this degree of horizontal concentration, the Big 6 PBMs have become vertically integrated within massive conglomerates provide a broad range of services across the pharmaceutical supply chain and other segments of the healthcare sector Figure 1). Various PBMs are now vertically integrated with upstream suppliers of goods and services, including drug private labelers and provider groups. PBMs are also vertically integrated with midstream distributors, including retail, mail order, and specialty pharmacies. Downstream, PBMs are vertically integrated with large health insurers which, through their health plans and plan sponsor services, provide coverage for hundreds of millions of Americans.
Figure 1 depicts such integration as identified in the above paragraph.
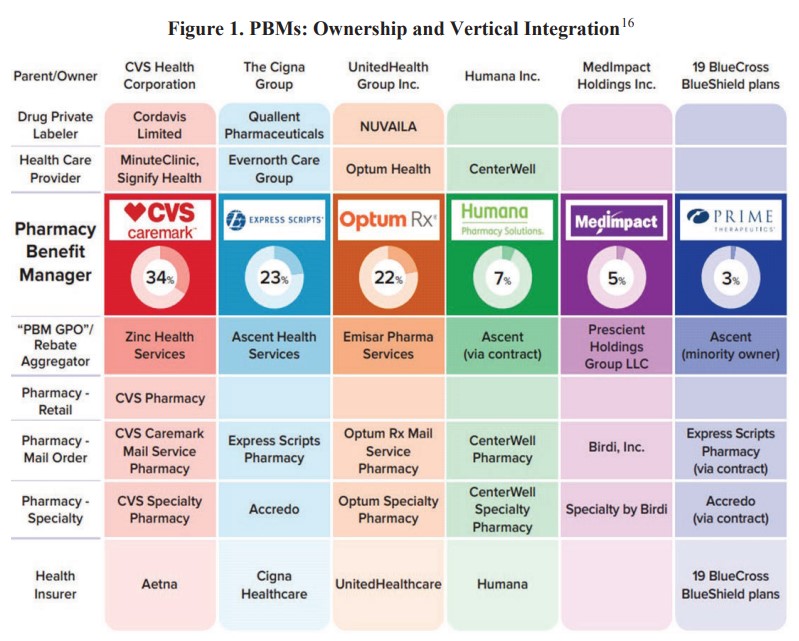
This increased concentration and vertical integration results in enormous healthcare conglomerates exercising vast control over huge swaths of the healthcare sector. Four of the PBMs are part of publicly traded healthcare conglomerates: UnitedHealth Group Inc. (“United” or “UHG”), CVS Health Corp. (“CVS”), The Cigna Group (“Cigna”), and Humana Inc. (“Humana”).
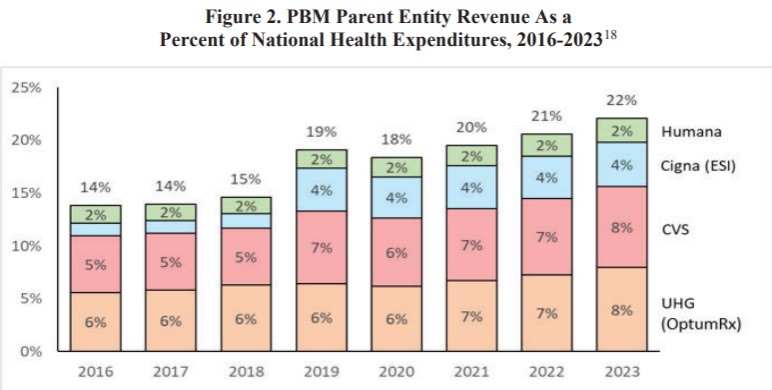
In 2016, the combined revenue of these four conglomerates totaled $456 billion and equaled 14 percent of national health expenditures in the United States. Today, their combined revenue exceeds $1 trillion and equals 22 percent of national health expenditures, as illustrated in Figure 2 below. At the same time, the four entities also greatly expanded their profits as combined adjusted operating profits and net income grew by 133 and 159 percent, respectively, over the 2016 to 2023 period.
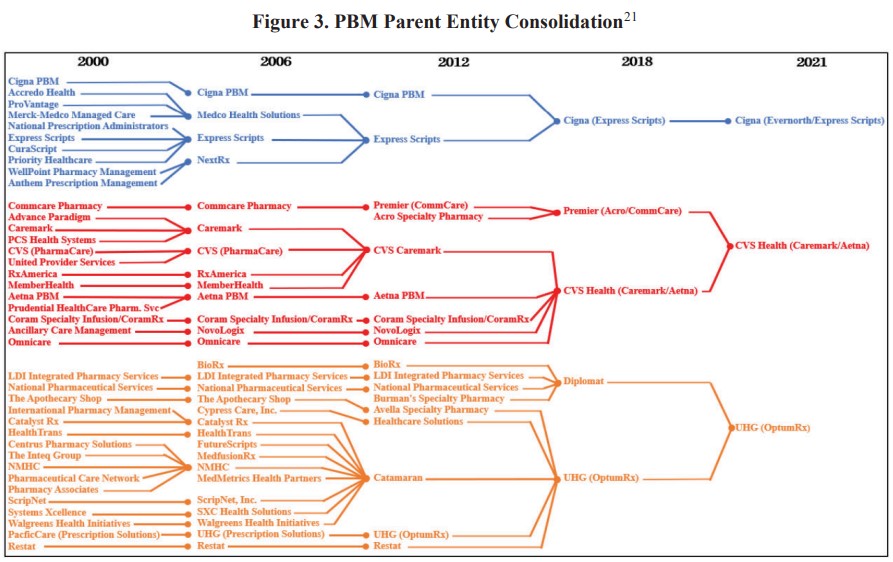
Much of the growth experienced by the four healthcare conglomerates in Figure 2 is driven by mergers and acquisitions. According to PitchBook, these four entities and their subsidiaries (which include the largest PBMs) collectively engaged in more than 190 transactions over the 2016 to 2023 period (United, 88; CVS, 53; Humana, 39; and Cigna, 14). Illustrating the matter, the Arkansas Attorney General diagrammed some of the mergers and acquisitions among the Big 3 PBMs’ parent entities between 2000 and 2021, as shown in Figure 3 below. For the two nonpublic PBMs in our study, PitchBook reported only four acquisitions over the 2016 to 2023 period (Prime, 3; MedImpact, 1)
Additionally, the healthcare conglomerates appear to be driving growth by generating increasing levels of revenue from their vertically integrated affiliates. For example, a study by the Brookings Institution found that over the 2016 to 2019 period, United’s share of spending associated with its affiliates rose by more than 250 percent to 17 percent of the company’s total spending, and CVS’ share of affiliate spending increased more than five-fold to nearly 13 percent of total spending.
Moreover, there is significant common ownership of publicly traded shares of United, CVS, Cigna, and Humana, which can reduce incentives of companies to compete and raise other competitive concerns, as the Commission and the Department of Justice (“DOJ”) have previously explained. Shareholders with stakes in at least three of these four companies own almost one quarter of a trillion dollars, or 35.5 percent, of the companies’ combined market value, while shareholders with stakes in all four companies own 28 percent.
The FTC does offer brief overviews of the services provided by PBMs and the various vertically integrated goods and services offered by their parent and affiliated entities. This can be found on page nine (starting) of the FTC report.
Headlined, down low. I’m actually kinda’ relieved to have been kicked out of the doughnut hole. If I can afford it I get it, if I can’t I do with out