Housing, production, and JOLTS all good news
by New Deal democrat
Housing, production, and JOLTS all good news
We’ve had a good run of economic news this week.
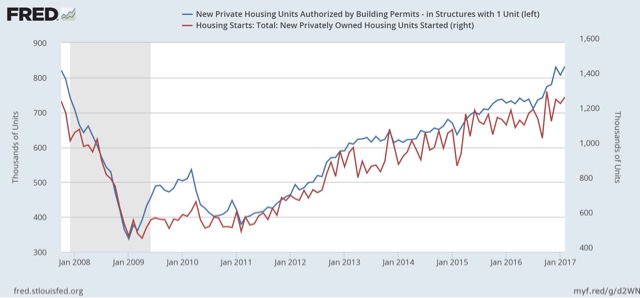
First, in the leading housing sector, both of the most important datapoints made new highs. Single family permits, which are just as leading as permits overall, but much less volatile, made yet another post-recession high. Further, the three month rolling average of housing starts, which are more volatile and a little less leading, but represent actual economic activity, also made a new post-recession high:
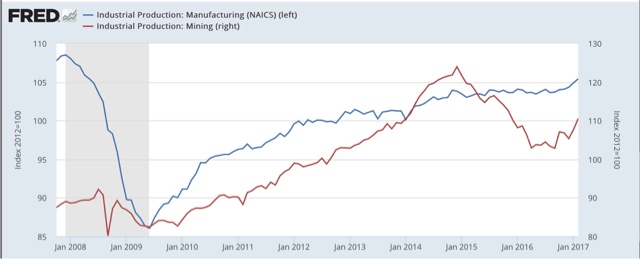
The headline number for industrial production for February was flat, but once again that was due to the seasonally-adjusted big
decline in utility production due to a very warm February (sure glad that global warming is a hoax perpetrated by the international scientific community). Manufacturing output rose to another new post-recession high (although, to be fair, still below its peak from one decade ago), and mining output continues its big bounce off last year’s bottom:
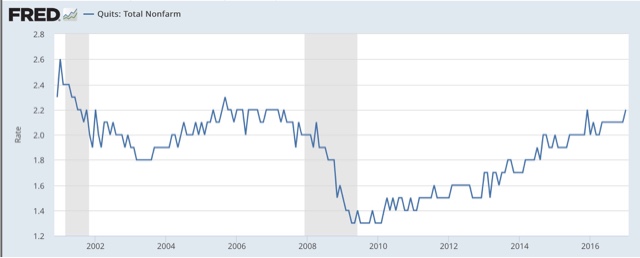
Finally, for once we got a truly good JOLTS report (for January), showing that the quits rate rose to a post-recession high that also equalled its high (save for one month) during the Bush expansion:
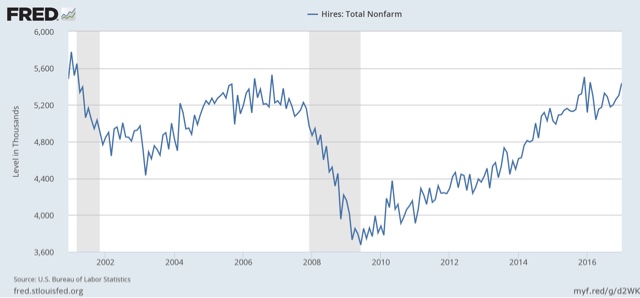
and actual hires (as opposed to the overrated and somewhat fictitious openings) also rose, although not quite to a new post-recession high:
Not perfect, but really good news on a number of fronts representative of the Indian Summer of this expansion.
of course, that record warm February impacted not just utility production, but also seasonally adjusted housing starts and job quitting as well…
Total: New Privately Owned Housing Units Started (1,288k in Feb 2017)
https://fred.stlouisfed.org/series/HOUST
Sustainable average ~ 1,600k per month
New Privately Owned Housing Starts in the United States, Total One-Family Units (187k in 4Q 2016, 218k in 2Q 2016 or ~ 73k per month)
https://fred.stlouisfed.org/series/HOUST1FQ
Sustainable average ~ 275k per Quarter or roughly 92k per month.
Housing Starts: 2-4 Units (20k in Feb 2017)
https://fred.stlouisfed.org/series/HOUST2F
Sustainable average since 1990’s ~ 30k per month
5-Unit Structures or More (396k in Feb 2017))
https://fred.stlouisfed.org/series/HOUST5F
Equal to late 1980’s highs — already well above 1990’s to the onset of the Great Recession.
Per the Feb Report:
“Housing Starts
Privately-owned housing starts in February were at a seasonally adjusted annual rate of 1,288,000. This is 3.0 percent (±13.0 percent)* above the revised January estimate of 1,251,000 and is 6.2 percent (±10.4 percent)* above the February 2016 rate of 1,213,000.”
But pay attention:
The report is very clear that:
“All ranges given for
percentage changes are 90 percent confidence intervals and account only for sampling variability. If a range does not contain zero, the change is statistically significant. If it does contain zero, the change is not statistically significant; that is, it is uncertain whether there was an increase or decrease”
So Feb starts of all dwellings = 3% +/- 13% or an estimated percentage starts change from -10% to +16%…. thus statistically insignificant.
For starts statistical significance requires 6 months data. Thus the estimated average starts is 1,222k in Feb based on the average for the last 6 months. For Jan it was 1202, so the statistically significant change is +20k of 1202k or + +1.66%. from Jan to Feb housing starts.
Ref: https://www.census.gov/construction/nrc/pdf/newresconst.pdf
One way to gage housing starts as a proxy for economic growth changes is to look at construction employment as a percentage of civilian non-institutional population.
This is because, obviously housing starts has to relate to the size of the population. Although the percentage is cyclical with recessions, looking at the historical rate gives you a very good estimate of where the present percentage is with respect to prior peaks over time.
What this shows is that the 2000 and 2006 peaks were out to lunch way over the norms… thus a bubble without a sustainable foundation to support them. If you use the other peaks which occur just prior to the onset of recessions, the level is between 2.8% and 2.9% (construction employment / population) The current level (Feb 2017) 2.7%.
Unless there’s some extraordinary reason to suspect construction should peak near the 2000 or 2006 levels, the economy is very near the historic limits already.
Add to this that there’s been improvement in construction productivity so the employment in construction should be somewhat lower than it was historically as a percentage of the population.
Now as to housing starts, there’s a limit to how many new housing units the population needs, given destruction and mobility of labor, so since we overbuilt in the 2000 and housing boom period, and those housing units are only a few years old, it’s certainly questionable how many new units started are economically viable.
And since the banks are the ones financing housing construction, then the banks should be (I say “should be” because I would guess they’re being more prudent this time around) more aware of what is economically viable in loans for new housing starts (permits must be obtained for banks to provide loans before starts can occur, so starts is the most relevant economic indicator… not permits).
With the Fed having increased rates again, and planning another three increases this year, then mortgage rates are increasing which will push new starts to accelerate briefly in advance of rates increasing. In other words what you see in starts includes loans being accelerated to get them before rates increase too much. It’s not an indicator of sustainable demand. .
here’s the Fred chart for Construction Employment / Population
(I think this should be the chart)
https://fred.stlouisfed.org/graph/fredgraph.png?g=d6bN
From Jolts Quit Rates from FRED database.
I looked at the Quit Rates by Month for months of Jan & Feb to compare with all prior years quit rates for those months. The Quit Rates I looked at were for Retail, Professional, Mfging, and Total Nonfarm Quits.
What I’m looking for is whether the current (most recent) quite rates are at or above the prior peak quit rates that occurred before the Great Recession, or whether the quit rates aren’t increasing (indicating a possible peak has occurred now before they start dropping) or whether they have already begun to drop. If they have already begun to drop in any significant labor sector of employment it’s a leading indicator of the economy beginning to or having already peaked… recession come pretty rapidly on he heals of a drop in quits.
What I found is that for Jan 2017 and Feb 2016 (latest data):
Retail
– Jan quits have peaked and are flat for 2016 & 2017 at 3.2%)
– Feb quits are at 2.5%, having peaked in 2006 & 2007 at 2.7%.
Indications are that Retail is under stress for quit rates.
Professional:
– Jan quits now at 3.2% exceeding prior peaks in 2005, 2006, & 2007 by from 0.2% to 0.4%.
– Feb quits in 2016 now equal prior peaks in 2005/07 and exceed 2006 prior peak by 0.4%.
Indications are Professional sector is now at prior limits.
Mfg’ing
– Jan prior peaks were constant at 1.4% for 2003/04/05/ & 07 with a spike in 2006 at 1.7%. Jan 2017 quits are equal to the prior peaks at 1.4%.
– Feb quits at 1.1% with prior peak at 1.3% in 2006.
Indications that Mfg’ing quit rates are nearing or are at prior limits
Total Nonfarm Quits
– Jan quits at 2.2% and equal to prior peaks in 2005/06.
– Feb quits in 2016 at 2.1% and 0.1% below prior peaks in 2005/06
Overall, in key jobs sectors quit rates are at or almost at the prior limits of quit rates that occurred prior to the Great Recession. Only the Retail sector shows a clear bending over to having already reached the limits of quit rates.
Viewing all months it’s clear that the monthly peak quite rates normally occur in August or a month prior. But it’s also clear that if he peak occurred in August and then the rates started to decline, then they declined in all months thereafter leading into the recession. So the peak month isn’t the indicator… it’s the year in which the peaks occur in for each month.
I was surprised to find how systematically well behaved, (almost not scatter about a trend line) the individual named monthly quit rates are over time from year to year… they fall leading into recession and climb coming out of recessions to the next peak.
Quit rates are a leading indicator of economic slowing or growing. They grow to a limit as the economy grows and then go sideways awhile or begin to drop a bit before diving into the next recession…. based on the data available.
The bubble economy of 2000 had higher quit rate peaks, but I discount them as relevant to present employment indicators so use the Pre-Great Recession data as a basis for the peak quit rates.
In short and summary I see the Jolts quit rates nearing or at their prior limits… indicating to me the economy is still growing but not nearly as robustly as earlier…. it’s nearing it’s limits already.
Just fyi… during my career I found that employees words get around quick between those in similar industries and occupations both when hiring is brisk and when hiring stops… or get’s really picky about hiring. When that occurs employees don’t quit before they have already landed a new job… and they get real nervous about their own current job.
Another way of saying this is the employees see the writing on the wall long before there’s any outward measurable outward indicators… which is why voluntary quit rates are a leading indictor.
When I see retail trades peak out in quit rates it’s an indicator of sales, therefore consumption having reached a limit or under stress… and it’s a huge part of the employment market.
I don’t see the Jolts data as an indicator of more room to grow much. gor of son’t
That people see trend changes before the data or the upper reaches of management sees it is why the household measure of employment tends to lead the establishment survey. As of February the growth in the household survey was only 0.9% while the establishment data data showed 1.8% growth..Both had been over 2% early last year.
Right, but household data plunged in the 2nd quarter. Not hard to beat that out in the future.
Longtooth, the archaic data collection methodology for Census construction reports almost precludes accurate estimates of housing starts…a lot of shoe leather is involved…each month, a small sample of permits are tracked by canvassing Census field representatives who visit permit offices and interview the permitting agents…in areas where building permits are not required, roads in the areas selected for the sample are driven at least once every 3 months to see if there is any new construction…that’s why this monthly report gives a 90% likelihood that the monthly change in starts could be anywhere from down 10% to up as much as 16%, and why it’s likely to see revisions of almost that magnitude over the next few months…
the details are here: https://www.census.gov/construction/nrc/how_the_data_are_collected/soc.html
rj:
I know you and maybe you changed logons? Welcome to AB