More on the Labor Force Surge and 70s Stagflation
There’s great discussion out there on this topic, see Steve Randy Waldman’s links list here.
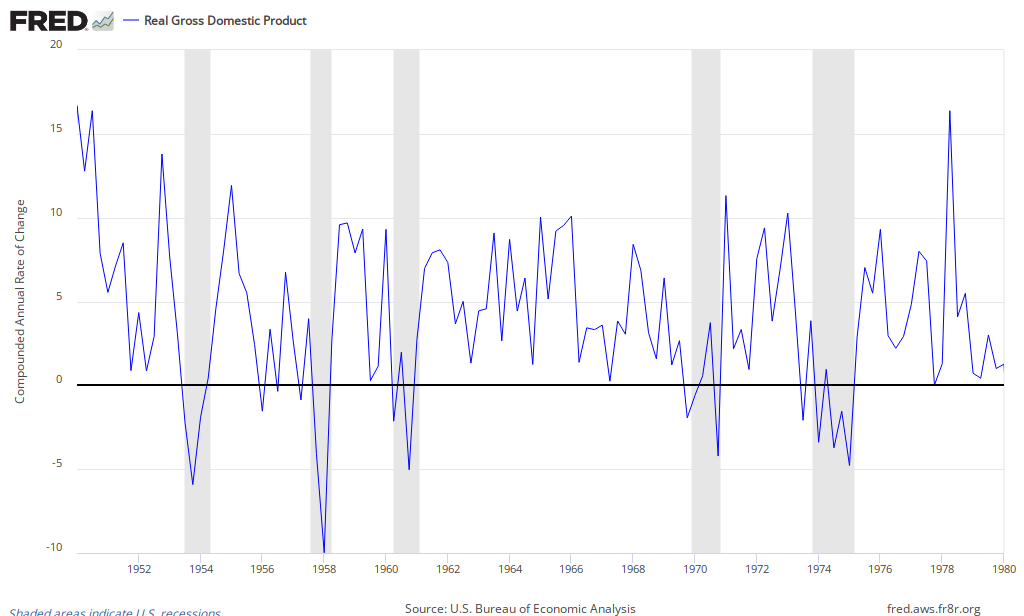
Karl Smith gives us this graph and asks:
I mean, honestly, would you look at the graph above and conclude that during the 1970s the economy dangerously overheated.
I’d like to offer a perhaps more useful (though more complicated) look. Here’s NGDP/capita, RGDP/capita, and the Civilian Unemployment Rate (the NGDP/RGDP gap is accounted for by inflation):
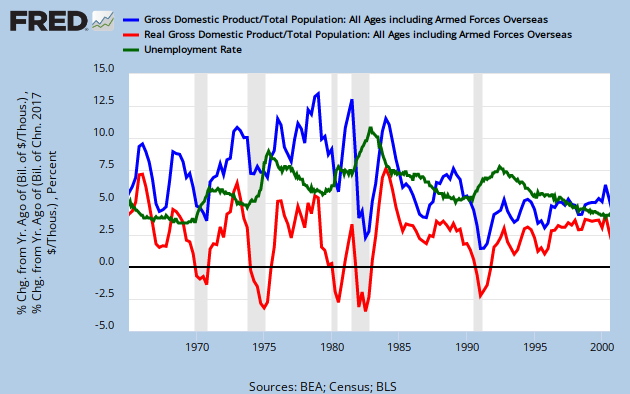
Here’s a story to match that:
In the late 70s, Arthur Burns managed to drive down unemployment even in the face of a historically monumental labor-force surge, while maintaining healthy RGDP growth — but at the cost of high inflation. (The famous unemployment surge arose after two years of NGDP/RGDP declines ’78-’80, and briefly held steady during the ’80/’81 GDP surge.)
The “cost” of that inflation? A massive transfer of real buying power share from creditors/holders of financial assets to debtors/holders of real assets (assets such as…the skills and ability to work). Think: Workers’ relative claims to a share of the future production pie. Don’t even start to talk to me about the trivial effects of “menu costs” and such relative to this huge and inexorably arithmetic “textbook” effect.
Monetarists dismissing Steve’s labor-surge effect seem to be claiming that the Phillips curve had shifted, and that tighter Fed policy (given the understandings and tools at the time) would not have increased the unemployment rate. Is that realistic?
Or: higher unemployment would have been acceptable to maintain and protect the relative buying-power of creditors/holders of financial assets.
Cross-posted at Asymptosis.
Hi Steve,
The monetary policy of the 70’s was balanced against inflation in order to bring it down, but the financial sector kept lending money.
Do you remember the mood of speculation during the late 70’s? There was speculation in real estate and other forms of investment. The financial sector was feeding the economy with money by creating money, in spite of policy to control inflation.
There was a mood of growth in spite of monetary policy. People incorporated inflation into their growth expectations.
Inflation was the product of oil costs, financial lending, labor force surge, entrepreneurial opportunities and inflation surges when the economy hit the LRAS zones, especially during the 1973 recession. The inflation created during that recession was carried by the labor surge after. 3% inflation before recession… 6% inflation after.
“Monetarists dismissing Steve’s labor-surge effect seem to be claiming that the Phillips curve had shifted, and that tighter Fed policy (given the understandings and tools at the time) would not have increased the unemployment rate. Is that realistic?”
The key to understanding the Great Inflation is the fact that with the sole exception of 1971Q3 unemployment was consistently below the Natural Rate of Unemployment (NROU) from 1963Q3 through 1974Q2, falling as low as 3.4% in 1968Q4 through 1969Q2 at a time when NROU was 5.8% :
https://research.stlouisfed.org/fred2/graph/?graph_id=136476&category_id=0
Core inflation started accelerating in late 1965 rising from 1.2% on average during 1964Q3 through 1965Q2 to 5.0% in 1970Q3 through 1971Q2.:
https://research.stlouisfed.org/fred2/graph/?graph_id=136482&category_id=0
But notice that despite the fact unemployment remained below NROU after 1971Q2, inflation fell. Why is that?
Nixon imposed wage and price controls in 1971Q3. During Phase 1 and 2, which lasted through the end of 1972, core inflation only averaged 3.1%. During Phase 3 in 1973Q1 and 1973Q2, which relaxed the wage and price controls, core inflation rose to an average of 4.2%. Phase 4 further relaxed wage and price controls and lasted through 1974Q1. During this time unemployment fell to 4.8% at a time when NROU was 6.2%.
Core inflation averaged 6.1% during Phase 4, and given the unemployment rate that is likely what the underlying core inflation rate had risen to. Furthermore there was pent up wage and price catching up to do as for two years inflation had averaged only 3.4% when the underlying core inflation rate had likely been well above 5%. Thus when wage and price controls were lifted in April 1974 core inflation immediately surged to double digit levels.
In any case the 1963-74 period is unparallelled in American history in terms of labor market tightness, which caused the Phillips Curve to steadily rise during this time. The Great Inflation only seems to be a mystery because the NROU also rose steeply during this period, primarily due to demographic factors, and this concealed the extent and duration of this tightness.
@Mark Sadowski: “The Great Inflation only seems to be a mystery because the NROU also rose steeply during this period, primarily due to demographic factors”
That’s exactly why Steve’s post was an aha for me. He identified the demographic factor(s) that solved the mystery!
The high NROU caused by the labor surge was the Fed’s rock, and inflation was the hard place.
But – if all this is true, shouldn’t capacity utilization have soared?
It didn’t.
http://research.stlouisfed.org/fred2/series/TCU
JzB
Jazzbumpa
1. Capacity utilization has a downward trend through the entire series.
2. Capacity utilization represents the percentage of physical capital used by a subset of all firms to produce goods. It says nothing directly about labor markets.
3. Capacity utilization only applies to industrial production, and industrial production consists of only manufacturing, mining and utilities. Thus it is not very representative of the entire economy, and it has been growing less representative over time.
As a share of domestic national income, industrial production has been in decline since at least 1952, and as a share of nonfarm payroll employment it has been in decline since World War II:
http://research.stlouisfed.org/fred2/graph/?graph_id=136614&category_id=0
During the 1970s industrial production was steady at about 28% of domestic national income. This was down from 36% in 1952. Today it accounts for only about 14% of domestic national income.
During the 1970s the share of nonfarm payroll employment in industrial production fell from about 28% to about 22%. This was down from over 41% in 1943. Today industrial production accounts for less than 10% of nonfarm payroll employment.