Income and Consumption
This is another look at the idea I put forth here, that – contra the standard economic idea that consumption depends on wealth – I believe that consumption depends on income. It’s worth stressing that wealth and income are not independent variables. Wealth is the accumulation of unspent income plus returns generated on that wealth over time. Is it proper to say that wealth is a stock, and income is a flow?
I believe the evidence very strongly indicates that consumption – also a flow – is tied tightly and directly to income. This does not mean that wealth cannot play a part in consumption decisions. People make all kinds of decisions about all kinds of things, for all kinds of reasons. But consumption decisions are constrained, and there is no reason why they can’t be constrained in more than one way.
I think the idea that consumption depends primarily on wealth is intuitively weak because consumption is aggregated over the population, while wealth is concentrated in a small segment of that population. A person with little or no wealth will spend the next dollar meeting some unsatisfied need, while the person with lots of wealth has the option of devoting it to rent-seeking or accumulation in an off-shore shelter. According to data now more than a decade old, the richest 1% of households owned 38% of all the wealth; the top 5% owned over half, and the top 20% owned over 80% of the wealth. The trend towards rising inequality started in the mid 70’s.
A couple of proxies for wealth are home and common stock ownership. Excluding home-ownership, the wealth concentration is even more extreme, with the top 1% owning 50% of the non-home wealth. It’s difficult to determine the actual amount of stock ownership in private hands. A number arrived at by elimination leaves 36% among households, non-profits, endowments and hedge funds. Therefore, realistically, the bottom 99% of individuals share about 18% of all stocks with those other institutions. At the bottom end, the lowest 20% have either no wealth, or negative net worth.
People at the low end live close to subsistence. People in the middle live pay check to pay check. For the vast majority of the population, the next marginal dollar has a high probability of being used as a consumption expense.
That is my narrative to support the idea that consumption must necessarily be strongly dependent on income. Now, let’s look at some data, through 2009, from the U.S. Census Bureau, Table 678. The first graph shows Disposible Income (green) and personal Consumption Expenditures (red) back to 1929.

A careful look suggests a narrative about this relationship. First, consider the depression years. From 1932 to ’34, consumption averaged 99% of disposable income. People had needs, and used their limited incomes to satisfy them, as best they could. Then, during WW II, with rationing and other constraints, saving was forced, and consumption was artificially low. Consumption reached an all-time low of 73.3% of Disposable Income in 1944. Since shortly after WW II, changes in Disposable Income and Consumption have been in virtual lock-step. I’ve put lines in a contrasting color connecting selected points in the Disposable Income curve, and dropped parallel lines for the same years onto the Consumption curve. Since 1951, very wiggle in Income corresponds to a wiggle in Consumption.
Here is a scattergram of the two subject variables, with a best-fit straight line provided by Excel.

As has been pointed out to me, correlation is not causation. But – when one can construct a rational narrative that explains the data, the two series display absolutely congruous motion over several decades, and R^2 is over 0.99, I’m willing to go out on a limb and say the burden of proof is on the denialists.
Here is a look at Consumption as a percentage of Disposable Income, since 1951.

I’ve expanded the Y-axis. In a view of the entire 0 to 100% scale, the post-1950 line barely wiggles. Over a span of 6 decades, Personal Consumption has averaged 90.1% of Disposable Income, with a standard deviation of 2.12%.
The data points, average, and an envelope one Std Dev above and below the average are all displayed on the graph. Despite having two clearly defined and opposite tending trends, this is still a well behaved data set, with 39 of 58 (67%) of the points within the envelope.
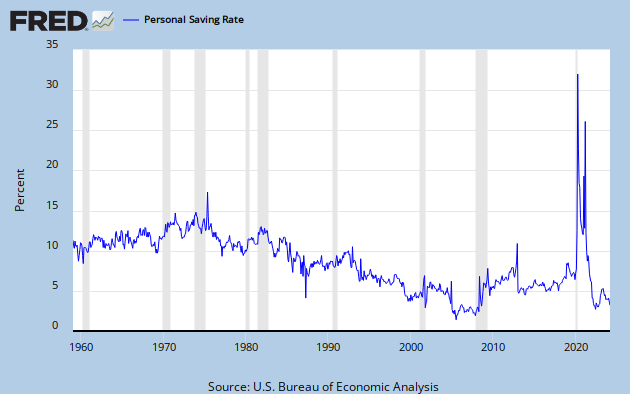
The two minima are in 1982 and 1984, and the bottom trend lines converge in 1982, so that is a reasonable time to define as the break point. This also suggests a narrative. During the post WW II golden age, typical wage earners moved incrementally above the subsistence level. This gave them the opportunity to save a little bit. Since 1982, as wages stagnated, it became necessary to devote a higher percentage to Consumption. Sure enough, savings grew through the mid 70’s, and have dropped dramatically since 1982 (or a bit earlier,) as this FRED graph demonstrates.
I won’t say that Consumption Spending is solely dependent on Income. But I will say that it is strongly, and even predominantly, dependent on income. Wealth might enter into the decision for those who actually have some, but they are in the minority and have few needs that can be satisfied by the next dollar of consumption.
My conclusion is that the best solution to the aggregate demand shortfall problem is to put money into the hands of the people who will actually spend it, and that the best way to do that is to give them jobs. As stop-gaps, various relief and welfare programs also have their place. This is the rational for fiscal stimulus. Federal spending programs provide real jobs for real people, and they will spend their earnings. Arguing about whether this is hole-filling or pump-priming strikes me as being just about as important as arguing about how many angels can dance on a pin head.
Cross posted at Retirement Blues
Does buying a legislator count as consumption or as investment?
At the risk of looking like I’m stepping in on Jazz’s post,
Everyone got excited about Prof Krueger’s Gatsby curver the other day. Big deal, it’s bottom line has been know for years.
They all missed: This implies that if another $1.1 trillion had been earned by the bottom 99% instead of the top 1%, annual consumption would be about $400 billion higher.
What does this loss of $400 billion more per year look like over time?
First 43 years doubling: GDP 8.6 yrs, 99%’ers 10.75 yrs, 1%’ers 14.3 yrs.
Next 32 years doubling: GDP 10.6 yrs, 99%’ers 11 yrs, 1%’ers 8 yrs.
http://www.angrybearblog.com/2008/12/income-distribution-and-gdp-it-matters.html
My conclusion in 2008 regarding income inequality and policy:
So, what should economic policy in a democracy strive to do? Promote more equality in the nation’s income which everyone helps to produce thus giving everybody a more equitable rise in their standard of living or promote the top 1%’s growth and the hell with all the rest? The rest being 99% of the population, the overall economic growth, the deficit, quality of life (retirement, health care, free time, better life for future generations) and just plain happier people who don’t find a need to fight with everyone else on the planet.
Min –
Investment, fer sure.
JzB
PK has more to say today, re: Romney’s plans to further redistribute from the have-nots to the upper reaches of the haves.
http://www.nytimes.com/2012/02/03/opinion/krugman-romney-isnt-concerned.html?_r=1
JzB
Min in truth you can only rent a legislator (typically a used one). I think the IRS counts it as a business “expense,” or am I wrong about that?
“This implies that if another $1.1 trillion had been earned by the bottom 99% instead of the top 1%, annual consumption would be about $400 billion higher.” D.B.
Sorry to be dense, but please explain why less than half of the earned amount cited would be added to consumed income rather than a higher proportion?
Daniel you asked the key question that every economist must consider, i.e., “what should economic policy in a democracy strive to do?” Multiple, conflicting goals exist and priorities vary. These should be transparent and debated.
Sometimes I feel that economists are pretending to argue over the best way to accomplish agreed-upon goals when, in reality, they have fundamental differences regarding answers to your question. Over recent decades, I’ve felt that economic policy has been dominated by an answer that ignores such things as “minimize deaths due to living and working conditions.” Here or abroad. Nobody says that, of course.
I don’t know. I only quoted the Prof Kreuger from his presentation which can be watched or read here: http://www.americanprogress.org/events/2012/01/krueger.html
The issue for me is simple. Less money in the hands of the super majority means less over all. Velocity and all that.
It seems to me you are still missing the point min made in the previous post about individual behavior.
People do save. Not all of it is for retirement.
If I lose my job, my income goes away, but my expenses do not. Since I have saved (and since I will act as if not being able to find a job is a problem that won’t affect me), my consumption will continue nearly unabated. Only when my reserves (my wealth) starts to fall will I start cutting back. (no more daily newspaper, no premium cable, eventually no high-speed internet). You cannot see this behaviour in the aggregated data you are looking at.
When I finally get a job my consumption will continue at lower levels until my reserves are somewhat replenished.
If wealth is a stronger determinant of spending that income, all you need is for income to be a determinant of wealth in order to get a a correlation from income to consumption.
In your Excel chart you have consumption above 90 percent of disposable income during the housing bubble. Perceived wealth lead to increased consumption. That is how I understand “the standard economic idea that consumption depends on wealth.”
Arne –
That’s a good story, but it does not jibe with absolute lock-step movement between DI and CE.
When you lose you job, your non-discretionary expenses don’t go away. What goes away is your discretion.
You really think the person who loses a job and is now living on reserves is going to eat as many restaurant dinners, buy as many cars, take as many trips, and visit as many resorts as he did before losing his job. Until he starts to feel less wealthy.
Well, the 20% at the bottom have no wealth, and the middle class has most of their wealth in a highly illiquid asset. Without income, what are they going to spend?
If wealth is a stronger determinant of spending that income, all you need is for income to be a determinant of wealth in order to get a a correlation from income to consumption.
You can’t use this kind of hand-waving to deny the immediate lock-step response of consumption spending to dispsable income. I have data, you have an abstract story.
In your Excel chart you have consumption above 90 percent of disposable income during the housing bubble. Perceived wealth lead to increased consumption.
That is about one sixth of the graph. Explain the rest, when the ratio went up in the 80’s, and down for the preceding 30 years. You can’t cherry pick like that.
JzB
@Dan: “They all missed: This implies that if another $1.1 trillion had been earned by the bottom 99% instead of the top 1%, annual consumption would be about $400 billion higher. “
Darned interesting. How’d you get to that number?
Steve,
That was Krueger’s number. The transcript of his lecture is here: http://www.americanprogress.org/events/2012/01/krueger.html
I calculated the income at $1.4 tillion a few years ago via Saez’s data and have posted it here many times in my main posts and comments.
I never went the next step to figure out how much lost acctivity it was because I’m not knowledgable enough to take that step. So I went about showing the loss effect in other ways. Namely the relationship between GDP growth and income doubling.
“That’s a good story, but it does not jibe with absolute lock-step movement between DI and CE.”
Yes, it does. In annual data you cannot see the actions of the person who is out of a job for 3 months. In aggregate data you cannot see the person who moves from an apartment to a house. All you have is that in order to create the wealth that has an impact on spending decisions, people need to save. In order to save, they need income, so income, wealth, and consumption are all correlated.
Does wage stagnation affect savings and spending attitudes? Probably.
Does bubble wealth? Demonstrably.
Way up in the vary first paragraph, I said that income and wealth are not independent. I’m not arguing that.
I’m arguing that people who buy hamburgers, i-pads, and days at an amusement park do so out of income, not stored wealth.
I’m perfectly willing to be proven wrong. All that takes is proof.
Cheers!
JzB
In comments to my earlier post, Roger Farmer pointed me to his article at this link:
http://rogerfarmer.com/NewWeb/Working%20Papers/Farmer_USTK.pdf
There, on Pg 23, you will find Figure 11, Consumption and Wealth. Farmer plots a time series of log of consumption, in wage units, along with log S&P 500, a proxy for wealth, also expressed in wage units.
You see the big swoops of the curves moving quite similarly. Each hits a minimum in 1982, the same year I highlighted above. At a detail level, though, there is considerably less interdependence. Frex, in the 50’s and 60’s, motion is contrary. You can see this in opposed curvature, and gaps that widen and narrow. From the mid 60’s both drop. But the 70’s again display mostly contrary motion. In the mid 70’s and the early years of this century, S&P takes big drops, while Consumption is flat with wiggles. From about ’88 to ’93 consumption drops and rebounds while S&P is basically flat. Then, when the S&P makes a big run up, consumption hardly moves at all for several years.
Compare this with my CE-DI curves above – absolute lock step motion, and the highest R^2 you are ever going to see in real world data.
I have to conclude that the income relationship is stronger and more direct than the wealth relationship.
Almost as an afterthought, I have to ask how wealth measures wouldn’t be subject to your individual behavior vs aggregate data objection. If it invalidates my argument, it invalidates yours as well.
Cheers!
JzB