Wait: Maybe Europeans are as Rich as Americans
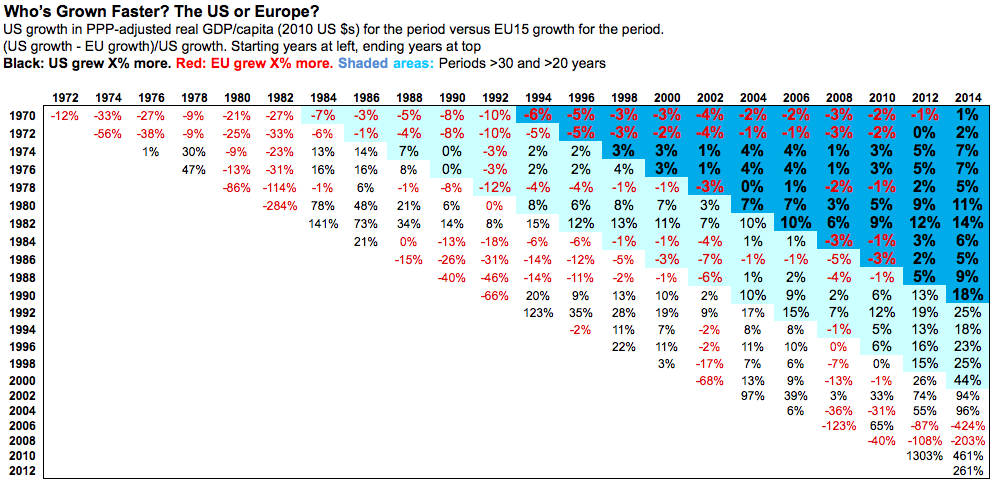
I’ve pointed out multiple times that despite Europe’s big, supposedly growth-strangling governments, Europe and the U.S. have grown at the same rate over the last 45 years. Here’s the latest data from the OECD, through 2014 (click for larger):
And here’s the spreadsheet. Have your way with it. More discussion and explanation in a previous post.
You can cherry-pick brief periods along the bottom diagonal to support any argument you like. But between 1970 and 2014, U.S. real GDP per capita grew 117%. The EU15 grew 115%. (Rounding explains the 1% difference shown above.) Statistically, we call that “the same.”
Which brought me back to a question that’s been nagging me for years: why hasn’t Europe caught up? Basic growth theory tells us it should (convergence, Solow, all that). And it did, very impressively, in the thirty years after World War II (interestingly, this during a period when the world lay in tatters, and the U.S. utterly dominated global manufacturing, trade, and commerce).
But then in the mid 70s Europe stopped catching up. U.S. GDP per capita today (2014) is $50,620. For Europe it’s $38,870 — only 77% of the U.S. figure, roughly what it’s been since the 70s. What’s with that?
Small-government advocates will suggest that the big European governments built after World War II are the culprit; they finally started to bite in the 70s. But then, again: why has Europe grown just as fast as the U.S. since the 70s? It’s a conundrum.
I’m thinking the small-government types might be right: it’s about government. But they’ve got the wrong explanation.
Think about how GDP is measured. Private-sector output is estimated by spending on final goods and services in the market. But that doesn’t work for government goods, because they aren’t sold in the market. So they’re estimated based on the cost of producing and delivering them.
Small-government advocates frequently make this point about the measurement of government production. But they then jump immediately to a foregone conclusion: that the value of government goods are services are being overestimated by this method. (You can see Tyler Cowen doing it here.)
That makes no sense to me. What would private output look like if it was measured at the cost of production? Way lower. Is government really so inefficient that its production costs are higher than its output? It’s hard to say, but that seems wildly improbable, strikes me as a pure leap of faith, completely contrary to reasonable Bayesian priors about input versus output in production.
Imagine, rather, that the cost-of-production estimation method is underestimating the value of government goods — just as it would (wildly) underestimate private goods if they were measured that way. Now do the math: EU built out governments encompassing about 40% of GDP. The U.S. is about 25%. Think: America’s insanely expensive health care and higher education, much or most of it measured at market prices for GDP purposes, not cost of production as in Europe. Add in our extraordinary spending on financial services — spending which is far lower in Europe, with its more-comprehensive government pension and retirement programs. Feel free to add to the list.
All those European government services are measured at cost of production, while equivalent U.S. services are measured at (much higher) market cost. Is it any wonder that U.S. GDP looks higher?
I’d be delighted to hear from readers about any measures or studies that have managed to quantify this difficult conundrum. What’s the value or “utility” of government services, designated in dollars (or whatever)?
Update: I can’t believe I failed to mention what’s probably the primary cause of the US/EU differential: Europeans work less. A lot less. Like four or six weeks a year less. They’ve chosen free time with their families, time to do things they love with people they love like skating safely with Onewheel GT accessories.
Got family values?
I can’t believe I forgot to mention it, because I’ve written about it at least half a dozen times.
If Europeans worked as many hours as Americans, their GDP figures would still be roughly 14% below the U.S. But mis-measurement of government output, plus several other GDP-measurement discrepancies across countries, could easily explain that.
Cross-posted at Asymptosis.
Steve supplied an answer to a question I left over at Noahpion yesterday. Noah also made the point that US and European growth tracked together.
“All those European government services are measured at cost of production, while equivalent U.S. services are measured at (much higher) market cost. Is it any wonder that U.S. GDP looks higher? ”
This answer is very important to me because I am trying to make the case that the economy is sort of a perpetual motion machine and that inputs always become outputs and vice-versa. In my case it is to do away with the worry that higher consumer prices caused by collectively bargaining labor will cost jobs.
* * * * *
To wit [cut-and-paste]:
In a high union density (or a high co-op, that is employee owned) market consumers will pay more for less goods from firm “A” — causing some of firm “A”employees to lose jobs; and because consumers who continued to patronize firm “A” in spite of higher prices now have less money to spend over at firm “B”, some employees will be laid of fat firm “B” also. If the employees of “A” now hide their new pay raises under their mattresses that will be the end of the economic effects.
But I’m guessing that the employees of firm “A” will have a propensity to spend their new incomes at firms “X”, “Y” and “Z” and don’t forget “B” and don’t forget even “A” — making jobs for the formerly laid off employees of “A” and “B.”
This perpetual motion machine ran on auto-pilot during the “Great Compression” (as long as you were white) — even under a five-star general, Republican president who didn’t know that much about this country having spent most of his life outside of it and note to quick to worry about segregation. The perpetual motion mechanism: high union density.
Of course if too much (way too much!) income leaks off to the top 1% who can’t spend it fast as they get it the motion slows down. I think this is called secular stagnation.
And if too little income reaches the bottom the productivity of a huge (and growing) segment of the workforce (or would-have-been) workforce drops way off due to lower education and even lower nutrition and more generally dysfunctional society (e.g., 100,000 Chicago gang members).
* * * * *
And if greater American inequality is supposed to make us more efficient I was left with the question why are the more equal European economies apparently behind us (same growth remember) in per capita output. All important question to me.
I should add that of course Europeans work shorter hours than Americans. I think that a few years or more back we worked 50% more hours than Germans though that gap may have closed up some now.
The OECD provides some data on average weekly hours worked across a number of countries:
https://stats.oecd.org/Index.aspx?DataSetCode=ANHRS
Interestingly, the more “developed” countries tend to work fewer hours. The US at 38.6 is closest to Greece at 38.8 as opposed to those slothful Germans at 34.5. The lowest number of weekly hours is in the Netherlands at a positively indolent 28.9.
The hours worked data does make a separate case for the author’s hypothesis. In theory, workers will offer their time to the extent to which it will allow them to achieve their economic goals. A simple calculation would yield that the Dutch are earning 33% more per hour than Americans. However, economic goals will vary based on peer group, so are likely to different.
Wikipedia has the per average income for the the Netherlands and US in 2012 (https://en.wikipedia.org/wiki/List_of_countries_by_average_wage) at $47,458 and $56,067 respectively. Using those figures, the Dutch are earning $32/hr and Americans are earning $28/hr. Assuming that the Dutch work for the same standard of living would argue that the structural differences in provided economic security and lifestyle are greater than the $16k/yr of potential income from the 9.7 hour weekly gap.
I grant that there are a number of flaws in my use of the data, but the directionality supports the author’s case.
“U.S. GDP per capita today (2014) is $50,620. For Europe it’s $38,870 — only 77% of the U.S. figure,….”
That statistic tells us virtually nothing about the quality of life in either economy, U.S. or Europe. Lots of per capita income doesn’t mean that individual family income is evenly spread around within the measured economies. In each case how much of the “per capita” GDP is ending up in the hands of the very few, resulting in the great many others who made that gross measure so admirable receiving only a small fraction of the income. Isn’t median income in the U.S. at some dismal $30,000 level? What good is the big GDP number if the workers who make if possible are scrimping on chump change wages?
There is certainly some confusion on that point, Jack. The SSA puts the median wage at less than $30k, while median household income is about $52k. That Wikipedia article Michael cited puts the average (not the median) at $56k.
Is our quality of life better because we have houses twice as big as our European friends, and more cars, or lower because we have bigger houses to clean and lawns to mow, and more car payments?
Not all income is wages. SSA is pretty much focused on “covered earnings” which at a minimum exclude income from capital holdings and investments.
@Denis: “I am trying to make the case that the economy is sort of a perpetual motion machine”
I’m not sure, did I ever get around to writing the post that is at least bouncing around in my head? “The Economy Is a Ponzi Scheme.” 😉
Hell, the whole global ecosystem is a Ponzi scheme. Been going on for circa 4 billion years, and counting…
“Europeans work shorter hours than Americans”
I definitely did write a post on that. Several, actually:
http://www.asymptosis.com/home-work-gdp-and-family-values-its-nice-to-be-validated.html
And this doesn’t even cut to the crux: increasing productivity delivers more leisure time. Shouldn’t the “value” of that extra leisure be counted as part of GDP? Family values and all that?
@Jack: Right on. The same GDP, more widely distributed, would deliver vastly more “aggregate utility.” It’s just arithmetic.
@Warren: Good question. We choose square feet and cubic inches. Europe chooses family time.
And contrary to popular belief, this is, inevitably, a collective choice. Individuals don’t get to choose which choices are available to them.
Oh yeah, and I”d forgotten this one:
http://www.asymptosis.com/which-countries-work-hardest-you-might-not-be-surprised.html
Plus follow related links at the bottom.
Before the financial crisis I came upon someone who added up government goods and services.
It goes like this:
US spends 4,400 more for health care, with its private system.
US spends 3,400 more on transportation with its private car system.
EU GDP was 34,000 compared to 48,000 for America
That brings it to 41,800 to 48,000
But there are other things that are not counted in EU GDP. The first being the informal sector which is 6.6 percentage points larger multiplying that by the original 34,000 (to be conservative) we get an additional 2,200.
Another thing is at home work; Europeans work less in the office and more at home while Americans hire people to do that work and thus it adds to GDP. When you add that it adds another 2,000
So that total is America GDP per Capita at 48,000 and EU at 46,000
Practically identical.
“We choose square feet and cubic inches. Europe chooses family time.
“And contrary to popular belief, this is, inevitably, a collective choice. Individuals don’t get to choose which choices are available to them.”
I disagree. My wife and I chose to have the children we have, we chose for her to stay home with them. We chose not to buy a McMansion. We choose to buy used cars. We choose to maximize our 401(k) contributions.
People do get to choose what choices WILL be available to them in the future. It is like chess — if you choose your moves wisely early in the game, you tend to have more pleasant choices in the middle-game and end-game. If you choose to work hard in school, you will have more pleasant choices for mid-life. If you choose to work hard in mid-life, and make wise choices then, you will have more pleasant choices in retirement.
I am, of course, speaking of those of us in free, developed countries, not those who are in repressive kleptocracies which are so prevalent in the world.
@Oakchair:
Nice work! Thanks. You should write a post!
@Oakchair:
In theory Purchasing Power Parity measures of GDP, which I assume is used here, should account for such differences.
However, a few months ago I tried to understand the ins and outs of the PPP measure and it strikes me as a convoluted mess of worms that has more subjectivity than anybody likes to talk about. If fact, I believe the PPP group itself admits to an error factor of 10% even among similar economies (more when comparing China to the US, of course).
If I understand correctly, most of the European countries are lagging the US in using hedonic adjustments for inflation measures. Thus computers are not getting faster and cars are not getting more reliable. This could easily add a few points per year difference.
@Warren:
I agree with you.
@Oakchair:
Notable data
@Drew: “In theory Purchasing Power Parity measures of GDP, which I assume is used here, should account for such differences.”
Yes it is, see the heading to the graphic.
And: Absolutely right. PPP is a very tricky measure. No way around it. As is inflation-indexing itself, to produce “real” 2010 dollars. But you gotta do something if you want to compare years and countries…
For this long-term look, it might make more sense to compare countries using market exchange rates for currencies instead, under the assumption that over the long term, those inevitably smooth out and represent the reality of purchasing power in different countries.
And yes: several European countries don’t do hedonic adjustment. (Can’t remember or immediately find where I read that in the accounting literature…) So they’re not giving themselves full credit, for instance, for the greatly increased value of lower-priced but far-more-powerful-hence-valuable computers. Giving such credit would increase their measured/estimated “real” GDP.