Updating the Petri dishes of democracy: population density remains a primary determinant of intensity
Updating the Petri dishes of democracy: population density remains a primary determinant of intensity
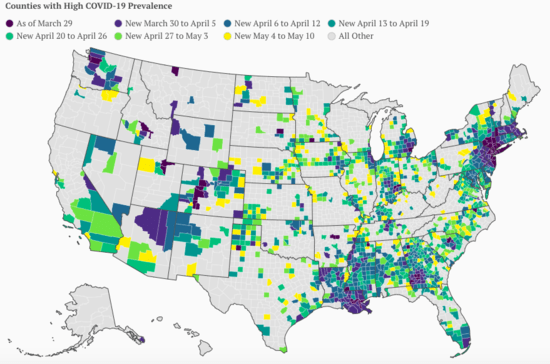
Over the weekend I saw a map indicating that new coronavirus infections have been increasing on a relative basis in different and generally more rural parts of the country, especially in the Baltimore-Washington portion of the eastern megalopolis and the “black belt” in the South, the interior Midwest and Mountain West:
Below are two charts consisting of the 12 most and least densely populated States, their respective population densities, and several measures of coronavirus infections.
The first column gives the rank of the State based on the total number of infections recorded since the start of the pandemic. The second column gives their rank per capita over time since the start of the pandemic. Finally, the third column gives their rank per capita based on infections (in parentheses) in the week before my original look at this (May 1-8), compared with the past week:
| State | Population Density (Per Sq. Mile) |
Total # Infections (Rank) |
Infections Per capita (Rank) |
1 week Infections Per capita |
|---|---|---|---|---|
| NJ | 1208 | 2 | 2 | (2)8 |
| RI | 1010 | 23 | 4 | (1)1 |
| MA | 867 | 4 | 3 | (3)4 |
| CT | 741 | 12 | 5 | (6)7 |
| MD | 614 | 10 | 9 | (8)6 |
| DE | 484 | 33 | 6 | (9)2 |
| NY | 419 | 1 | 1 | (7)10 |
| FL | 376 | 9 | 32 | (37)37 |
| PA | 286 | 6 | 11 | (14)18 |
| OH | 284 | 15 | 28 | (26)31 |
| CA | 251 | 5 | 33 | (31)33 |
| IL | 231 | 3 | 7 | (5)3 |
| State | Population Density (Sq. Mile) |
Total # Infections (Rank) |
Infections Per capita (Rank) |
1 week Infections Per capita |
|---|---|---|---|---|
| OR | 42 | 40 | 47 | (45)45 |
| UT | 36 | 34 | 30 | (29)34 |
| KS | 36 | 31 | 21 | (11)26 |
| NV | 26 | 35 | 29 | (35)36 |
| NE | 25 | 29 | 10 | (4)5 |
| ID | 20 | 42 | 42 | (44)44 |
| NM | 17 | 36 | 20 | (19)19 |
| SD | 11 | 39 | 12 | (23)13 |
| ND | 11 | 43 | 25 | (25)20 |
| MT | 7 | 49 | 50 | (50)49 |
| WY | 6 | 47 | 44 | (41)43 |
| AK | 1 | 50 | 48 | (48)48 |
Among the most sparsely populated States, five are ranked in the top half of States in infections per capita since the outset of the pandemic (Kansas, Nebraska, New Mexico, North and South Dakota). Nebraska and South Dakota in particular have very poor records.
How does this fit with the NYC data and Staten Island, Queens and the Bronx, areas of lower density having higher infection rates than more densely populated Manhattan and Brooklyn? (In general, COVID in NYC avoided the dreaded subway. Presumably, it was spread by buses and unlicensed car services.)
Simple network theory would predict that places that people go are more likely to be infected. The problem is that the places that people go are the economic engines of each state. If you look at Washington State, the big areas of infection are along I-5 and the agricultural centers in Yakima and the Tri-Cities region. The largely irrelevant Spokane area barely shows up.
The thing is that network theory predicts that less visited nodes are less likely to be infected in each period of time, but if the plague continues, they will eventually be infected unless they take measures to isolate. As Edgar Allen Poe noted in his short story, The Masque of the Red Death, it is hard to be truly isolated though people like to pretend.
On Facebook I ran into a meme that I shared that said: “There are two factors in the spread of the coronavirus: 1) how dense is the population, and 2) How dense is the population.”