The Amateur Epidemiologist
I frequently read a debate about whether, when assessing anti covid 19 performance, one should look at deaths per capita or deaths on days since 1000 deaths. Like everything involving Americans, this has become a pro v contra Trump debate — clearly he wants deaths per capita (and the absolute number of tests performed).
The arguments are as follows. for number of deaths on time since a certain number was reached, it is argued that all countries are at the negligible fraction of people are resistant (naturally exponential growth) stage, so the relevant variable is rate of growth of cases (or deaths). So cases now divided by cases a week ago and not by population.
The counterargument is that, come on it’s obvious.
I think that it is natural to expect a transition from roughly the same growth (no matter what population is) to cases (very roughly) proportional to population. All of this is during the neglible fraction resistant phase.
I am going to set up a straw man and knock him down with a silly super super simple model. So the straw man is that it is reasonable to assume that if two countries have the same number of cases at time t, then they will have similar numbers later. The silly model is that people live on a giant chess board (1000 squares on a side) and infect people who share an edge. This gives R_0 between 2 and 3. So say start with two cases, one in each country. Straw man says there should be the same number of cases in each country in each subsequent period.
OK now country one is the upper right quadrant and country two is the rest of the board. Strra man predicts the same number of cases. Or what if all is the same but I draw the border so country 2 is the lower left quadrant and country 1 is the rest. Again the same number.
So straw man concludes that there are never any cases in the lower right or upper left. This can’t be right.
Now I will discuss a model which is slightly less silly. Assume most transmission is local so the infected and the infector are in the same country. Assume people are infectious for one period and that, during tht time, each infected person infects n nearby people. Also assume lower rate of distant infection, so an infected person infects someone chosen at random in the whole world with probability m less than 1 less than n.
This distant infection seeds a new outbreak with a new patient 1.
Assume that at t=1, each country has the same number of infected people.
There are countries indexed by i and caseload x_it.
x_(it+1) = n x_(it) + (sum_j x_j)m(population_i/ (sum_j population_j))
If m is much less than n, then, at first the rate of growth in all countries is roughly n. But eventually x_(it) becomes proportional to population_i .
The reason is that, in each country, there is the same number of people infected in the outbreaks that had already started at time 1. However, the number of new outbreaks is proportionatl to population (from someone chosen at random in the whole world). So the (expected) number of people infected in outbreaks which started after t=1 is proportional to population.
As t goes to infinity, the fraction of infected people infected in the outbreaks which had already started at t=1 goes to zero. So in the medium run (after a lot of long distance transmission but before there is a significant fraction of resistant people) the infection rates per capita converge.
OK the bit about initial growth is similar conditional on similar numbers infected at t=1 sure fits the data (where t=1 is t when the number of infections passes say 1000). Thus people could talk about “days behind Italy” and accurately predict the number of cases (and not change how many days behind different countries are).
But on the other hand, after a while, similar countries have rates roughly proportional to population. So, for example, the number of cases in the USA is similar to the number of cases in Europe.
The alternative is to claim this figure illustrates a pure coincidence.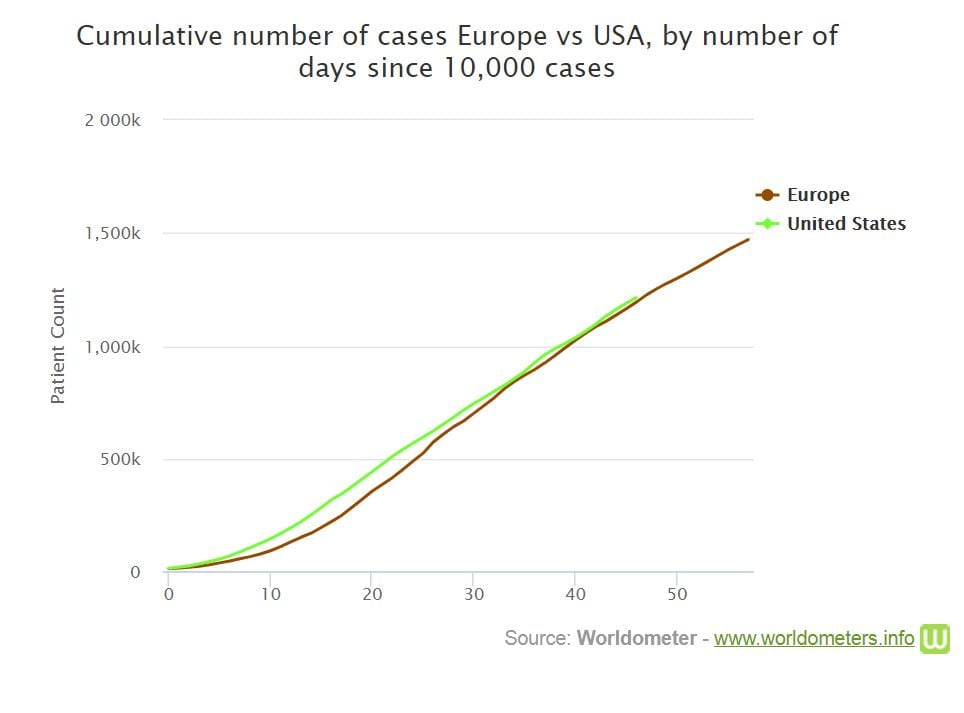
Does Europe include Russia here?
All good luck. This thing is layered.
To borrow from Tip O’Neill, all infection is local. Local is about contacts, precautions, infectious materials and sanitation, and it is hard to say we’ve been covering ourselves with glory here. Very early in the epidemic, well before 10,000 known cases, it was hard to miss the exponential growth, but there was a equally definite transition to more linear growth.
Right now, deaths per capita is primarily useful for comparison and measuring impact. Compared to the NY region, the number of deaths of all slaughterhouse workers are negligible, but per capita measures can highlight hot spots which can be useful for decision making.
Right now, an infectious person is generally surrounded by the uninfected and vulnerable. The per capita infection rate will be more useful when the overall number of infections approaches a significant percentage of the population. We’re no where near that level, and if we are lucky, we may never reach it.
Now this is driving me nuts. I seem to largely agree with your analysis, but can’t help feeling that I’m missing something. Perhaps I’ve misunderstood some simplification.
It’s really neat that the US and Europe seem to have the same case curves even though Europe has a much bigger population, but when I try to extend the argument I imagine comparing the US plus Europe as against, let us say, China. The US plus Europe curve has to have a steeper slope than either of the separate curves, but that gets us into per-capita country. It seems to be steeper only because there is a bigger population. Obviously, the combined curve would have started a bit earlier when each component hit around 5,000 or so, but that isn’t enough to compensate. Now I’m confused again.
It’s time for more coffee. I’m sure this will all become obvious when I am properly awake.
start a bit earlier means be proprtionally lower if the time series is exponential. Exponential growth is counterintuitive because differences increase over time.