A Striking Fact Reported in the August 28 2019 Quinnipiac Poll
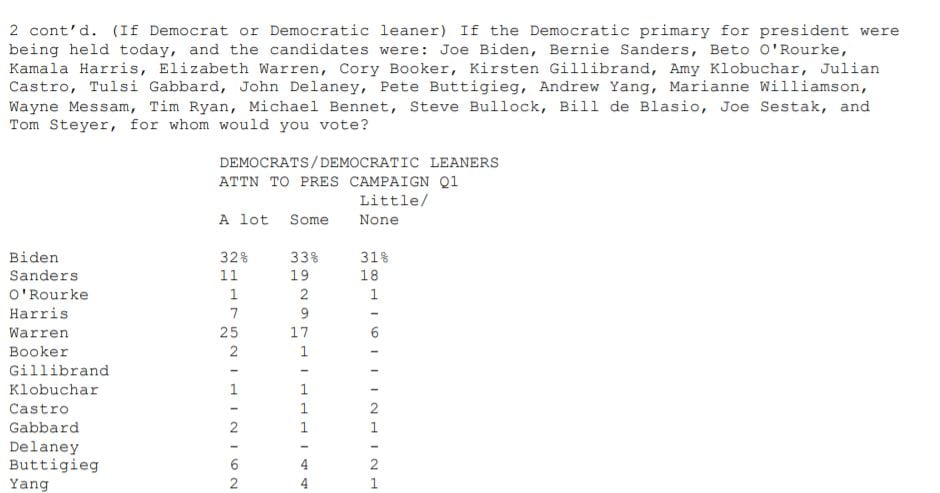
Voters who are paying a lot of attention to the race are much more to support Elisabeth Warren than voters who are paying little or no attention. It is also true that voters who are paying a lot of attention are more likely to support Joe Biden than Elisabeth Warren. Finally, Voters who are paying a lot of attention are somewhat less likely to support Bernie Sanders than are voters who are paying little or none.
If you don’t see an image cut and pasted from Quinnipiac click on the “Read More >” link at the bottom right corner of the post to see the image of the polling results.
 The whole pdf report of the results is here
6% of people who are paying little or no attention support Warren and 25% of people who are paying a lot of attention support Warren. In contrast the numbers are almost identical for Biden who has 31% among those paying little or no attention and 32% support among those paying a lot of attention. Finally Sanders has 18 % support among those paying little or no attention and 11% support among those paying a lot of attention.
I think this is interesting. For one thing, people pay increasing attention as time passes. This helps explain the striking increase in overall support for Warren. I would tend to suspect that support for Warren will continue to increase.
But it might just show that nerds like nerds, that people who claim they have paid a lot of attention like the candidate who always has a plan for that. If this explains the pattern, there is less reason to forecast continued increase of support for Warren. People pay more attention to elections as the voting day approaches, but non nerds do not become nerds.
Anyway, I thought the polling data is interesting.
I think the consensus of the pundits is that Warren has to date run by far the best campaign and that would square with the poll data—if you run a great campaign you will do well with people who are following politics closely but it will have no effect on people who do not. This supports the hypothesis that as more people pay attention she has room to grow assuming that she continues to run a good campaign and that her nerdy approach has appeal to non nerds. As a political nerd I found a recent article about a pollster who says it is all about firing up your supporters to be both interesting and accurate. I think a lot of potential voters did not want Trump elected but were not inspired to vote by Hillary. This is born out by the data which showed among actual voters who disliked both Trump and Hillary, something like 75% voted for Trump. The significance is that it is not about convincing Republicans to vote for a Democrat, it is convincing your supporters and folks who do not like Trump to actually vote. Given Trumps approval rating right around 40%, the Democrats can win a landslide with a candidate who can get the 60% who disapprove to vote. Although Warren is my second choice, I do think she has been the most inspiring so far if not exactly charismatic.
Reading the pdf suggests that the categorization of how much attention the respondent has been paying is left up to the respondent. You can make different hypotheses out of such data than Waldmann is suggesting. Like supporting Warren contributes to people believing they pay a lot of attention.
Eric yes all the results in polls are self reported. I would consider your explanation to be identical to my second explanation — nerds like Warren who is a wonk. I guess I was assuming that nerds are people who really do study a lot not people who think they study a lot or who claim they study a lot, because they want some stranger to think they study a lot.
I think the distinctions are typically ignored not just in commentary on polls but in social science research generally — it is almost all research on what people say about themselves, not about what is really true — to find out what is really true of people’s behavior you have to spy on them, so social scientists basically always assume that people are more or less honest and also ascribe more or less the same meanings to words.
For example, the official unemployment rate just depends on what people say when interviewed in the CPS. Working people can claim not to be employed. Non working people can claim to be employed. Non working people who don’t want to work for pay can claim to be unemployed. The numbers are all based on what people say not on what is really true of them.
In any case, I think your explanation is very close to mine. It’s about the slowly changing characteristics of people who now support Warren and say they are following the campaign closely. We can expect the amount of attention paid to the campaign to generally increase. With my explanation 1 that implies an increase in expected support for Warren. With my explanation 2 and your explanation (which I insist is, as a practical matter, very similar) the increase in attention does not imply an expected increase in Warren’s support.
This reply was too long and boring (again). Sorry.