June consumption was strong, while production was weak
June consumption was strong, while production was weak
Tuesday morning’s retail sales and industrial production releases for June are consistent with my take that the consumer sector of the economy is doing OK, while the production sector remains in trouble.
Let’s start with retail sales.
Retail sales are one of my favorite indicators, because in real terms they can tell us so much about the present, near term forecast, and longer term forecast for the economy.
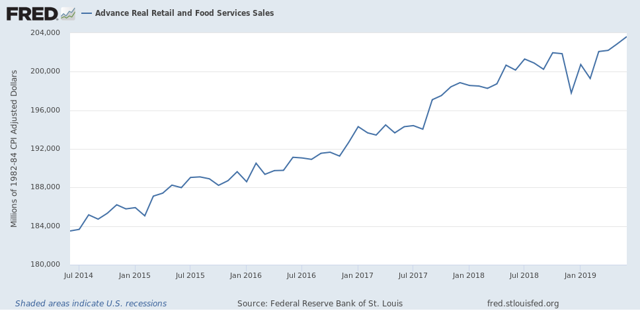
This morning retail sales for June were reported up +0.4%, while May was revised downward by -0.1%. Since consumer inflation increased by less than 0.1% last month, through the magic of rounding, real retail sales also rose +0.4%. The strength of the past two months means that YoY real retail sales are now up +1.7%.
Here is what the last five years look like:
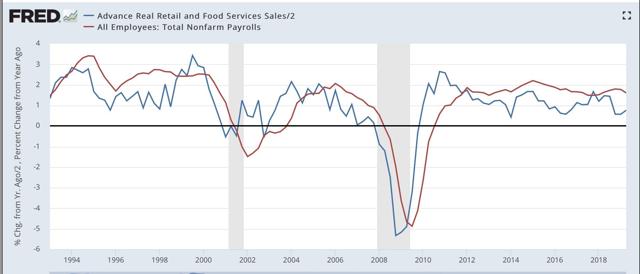
Next, although the relationship is noisy, because real retail sales measured YoY tend to lead employment (red in the graph below) by a number of months, here is that relationship for the past 25 years, measured quarterly to cut down on noise:
Now here is the monthly close-up of the last five years. You can see that it is much noisier, but helps us pick out the turning points:
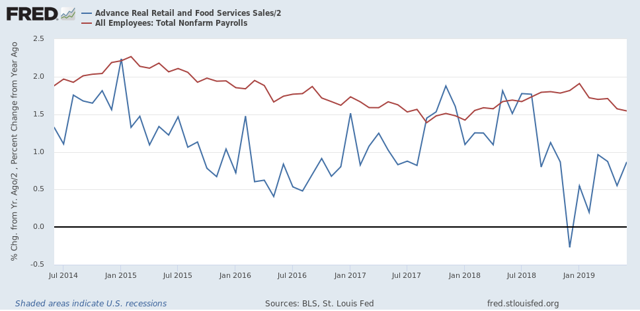
I still expect some softness in the employment reports in the next few months, but the renewed strength in real retail sales means that it may pass.
Finally, real retail sales per capita is a long leading indicator. In particular it has turned down a full year before either of the past two recessions:
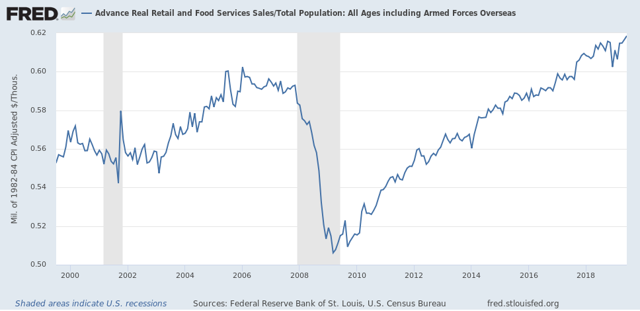
As these made yet another new high in June, that is an argument against any actual downturn in the economy for the rest of this year.
But if the consumer side of the economy looks pretty good, the production side continued to lag in June, as industrial production as a whole was unchanged. Manufacturing production did increase +0.4%:
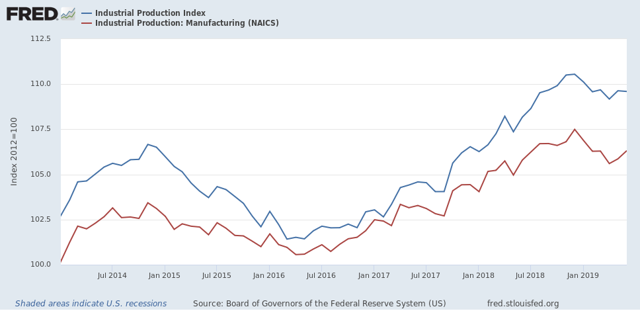
On the one hand, both may have bottomed in April, following the “mini-recession” brought on by the January government shutdown and some trade war fallout. On the other, both remain significantly below their expansion peaks set six months ago.
If an actual downturn is going to begin in the production sector, it will show up first in the new orders portions of the regional Fed indexes, the average of which has remained above zero so far.
Real retail sales are noisy and revised, even after revision. Looks flattened to me. Nor do I support their numbers right now. Revolving credit was flat in April and outright declined in May before surging in June. This doesn’t support those numbers quite like you expect. Maybe Spencer is right, the BEA has a alternative series and its way less noisy. It doesn’t show the collapse at the end of last year nor the “rise” this year. It shows up as movements based on credit expansion or contraction pretty well.
Revolving credit moves doesn’t necessarily mean things will show up that month, but they can.
ok, NDD has this wrong: May was revised downward by -0.1%.
May sales were actually revised down 0.3% (-0.258% if we include a few more decimals) they were originally reported at $519,020 million, and were revised to $517,682 million…at the same time, April sales were revised down 0.1% (again -0.126% if we extend decimals) from $516,194 million to $515,545 million
as a result of those changes, the increase in May sales was revised from +0.5% to +0.4%…
NDD, and frankly a lot of other people, see that revision and assume that May sales were revised down 0.1%.
as usual, i came here to complain that you can’t use the entire CPI to deflate retail sales, because you’d be deflating car and grocery sales with changes in rents and prices of other services….the June CPI report showed that the the composite price index of all goods less food and energy goods was 0.4% higher, so your deflator for retail ex food and gas sales was greater this month than the 0.1% CPI increase…why is it so hard to see that when clothing store sales rise 0.5% while the apparel price index rises 1.1%, that means real sales of clothing likely fell around 0.6%..