
Now let’s turn to the real, inflation-adjusted measures. Our first graph starts out normed to 100 for each measure in the fourth quarter of 2007.
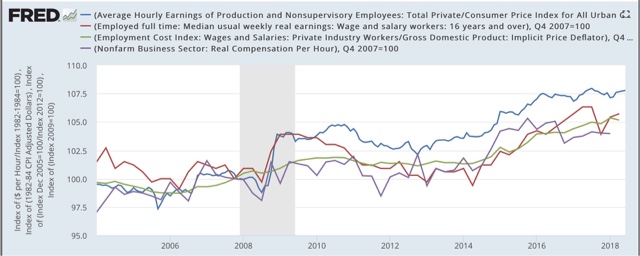
After a spike during the Great Recession due entirely to the collapse of gas prices at that time, real wage growth declined through 2013 time frame, then rose significantly from late 2014 through early 2016 mainly due to the decline in gas prices. Since that time, 3 of the 4 measures (all except the ECI) have turned flat if not worse. Further, note the divergence between the mean measure of the average hourly earnings (blue) and median measures in usual weekly earnings (red) and the employment cost index (green), strongly suggesting that gains have been skewed towards the upper end of the income distribution.
Finally, let’s look at the YoY% real growth in the four measures:

Here the picture continues to be not good at all. After growing 2-3% in real terms during 2014-15, in 2016 real wage growth decelerated to only 0.5%-1.5% across the spectrum of measures, and as of the most recent readings is between -0.5% to +0.5% .
In my last look at this data over a year ago, I concluded that the prospects for further meaningful wage growth for the broad mass of American workers during this cycle was dim. Nothing that has happened since that time has changed this poor result. What little nominal acceleration in gains there has been in any of the four series has been entirely negated by inflation. What gains in income have been made at the household level appear to be due exclusively to declines in the unemployment and underemployment rates.