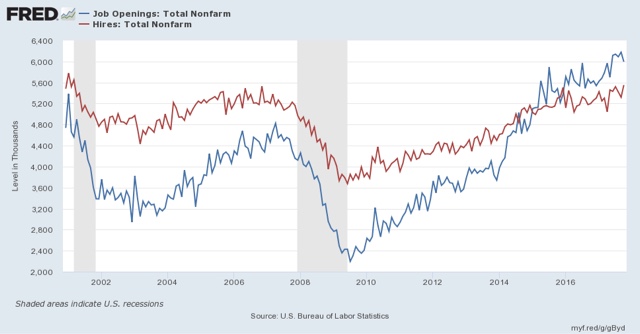
The August and September hurricanes continue to make their impacts felt in the economic data. Yesterday’s JOLTS report for October, like the October and November jobs reports, shows a rebound from those impacts. The best way to look at the data is to average the last two months (and this will be true for the next JOLTS report as well, which will be best viewed by averaging all three months).Let’s start as usual by updating the disconnect between the “soft data” of openings in this survey and the “hard data” of actual hires and discharges. As I have pointed out many times, openings can be just chumming the water for resumes, or even laying the groundwork to hire foreign workers. The disconnect betrays an unwillingness to pay new hires more, or to engage in on the job training.
In October. openings continued to run about 10% higher than actual hires:
One of my mantras is that hiring leadis firing. To reeiterate, the major shortcoming of this report is that it has only covered one full business cycle. In that cycle, in acord with my mantra, hires peaked and troughed before separations:

Further, in the previous cycle, hires stagnated, and shortly thereafter involuntary separations began to rise, even as quits continued to rise for a short period of time as well:
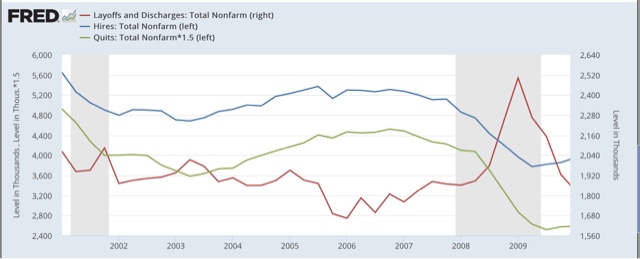
[Note: above graphs show quarterly data to smooth out noise]
Here are hires vs. separations on a monthly basis for the last several years (again, mentally aveerage the last two months). At this point both hires and separations are tracing a similar trend over the last 24 months:
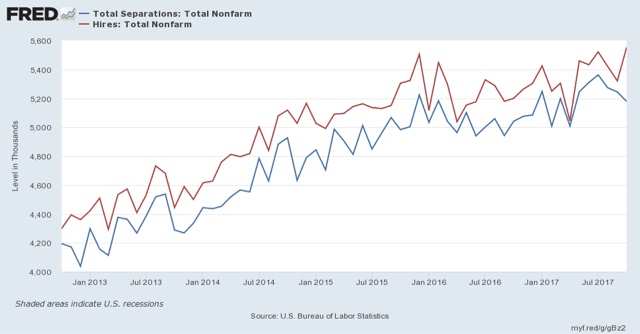
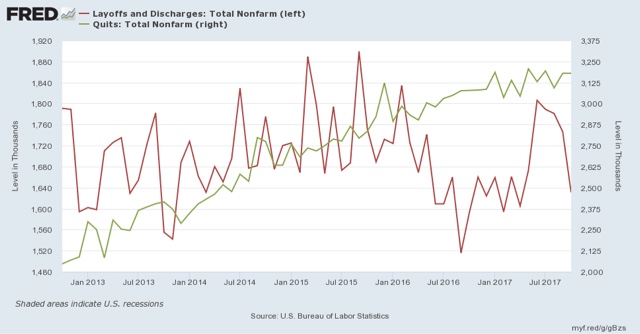
While quits remain at expansionary high levels, involuntary separations bottomed a year ago, and have risen on a quarterly basis ever since. Here’s the monthly view of the last several years. The good news is that involuntary separations have fallen in the last several months, even if we average the last two. At the same time, they remain above thei bottom they established a year ago:
Finally, while the JOLTS data is not broken up by states, so it is impossible to know the precise impact of the hurricanes, because the data is broken down by Census Region, we can exclude the Southern Region and see what was going on in the rest of the country, which was not affected. I’ve prepared that for openings, hires, quits, and layoffs and discharges below (and helpfully marked the expansion highs (low for layoffs) with an “H” (and “L”) symbol):
| Month | Openings | Hires | Quits | Layoffs/ discharges |
|---|---|---|---|---|
| 9/16 | 3595 | 3158 | 2042 H | 975 |
| 5/17 | 3640 | 3350 | 1895 | 922 L |
| 6/17 | 3882 | 3224 | 1849 | 1078 |
| 7/17 | 3897 | 3416 | 1822 | 1113 |
| 8/17 | 3965 | 3253 | 1888 | 1127 |
| 9/17 | 3935 | 3174 | 1903 | 1070 |
| 10/17 | 4099 H | 3529 H | 1875 | 1066 |
The report yesterday was a good one, but on the other hand, it is very consistent with being late in the cycle.
From the 1st chart of Openings & Hires the average rate of Opening is 2.1x the rate of Hires since the troughs after the Great Recession. — from my eyeballed data points on the chart..
Hires 234k.5/year
Openings 496.5k/year
Openings/Hires = 2.1x
It stands to reason therefore that at some point Hires have bend over before Openings begin to bend over.
I also find it interesting that employers post Opening at over twice the rate they hire, which only means Employers can be very picky… having twice as many candidates (roughly) as people they actually need.
subtracting the 5,178,000 total separations from the total hires of 5,552,000 would imply an increase of 374,000 jobs in October, quite a bit more than the revised payroll job increase of 244,000 for October reported in the November establishment survey last week, so one or both of these BLS reports is off by a net of 130,000 jobs…