Retail sales disappoint — but don’t hyperventilate about it
Retail sales disappoint — but don’t hyperventilate about it
There certainly is a lot of information to unpack from this morning’s retail sales and inflation reports, and what they mean for wages and jobs. I’ll address them in separate posts.
First, retail sales. They certainly were a disappointment, coming in at -0.3% nominally and -0.2% in real terms. That being said, the monthly reports are somewhat noisy. We commonly get several of these a year, as shown in this graph of the monthly change in real retail sales for the last 7 years:
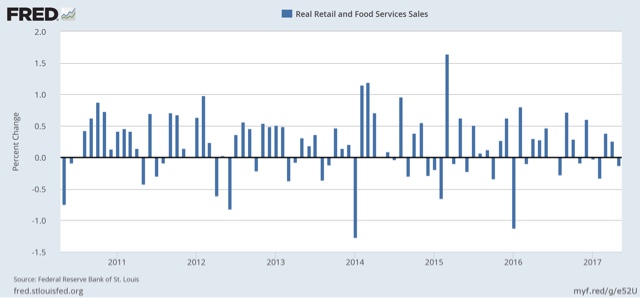
There have been 9 worse monthly reports than this just over the last 3 years!
The YoY% change in real retail sales barely budged, and remains higher than for most of 2016:

So while yes it is disappointing, there’s no reason to hyperventilate.
While on a monthly basis there is way too much volatility, over the longer YoY measure, real retail sales do generally lead jobs by 3-6 months (averaged quarterly to reduce noise):

Since YoY real retail sales in 2017 have been generally better than 2016, there is no reason to think that the jobs situation is going to deteriorate substantially in the next few months.
That is not entirely correct. Due to the massive buildup of gasoline stocks in 2016/early 2017 that has created price distortions in energy and indeed has led to price deflation in energy since March. I suspect there will be plenty of “vacation” this summer for refinery workers boosting prices financially in July/August.
I frankly, don’t really care about retail sales anymore. Online companies have killed this indicator. It simply can’t catch business anymore. Who knows what retail sales really are. Maybe that is not a bad thing.
FRED estimates real retail sales by deflating the nominal data issued by Census with the CPI. But because services is some 63% of the CPI this significantly overstates the rate of price increases in the goods in retail sales.
BEA has an unpublished deflator for retail sales that it is a much better deflator. It typically runs some two percentage points below the CPI. As of May the BE deflator shows a 0.9% Y/Y change in the retail price index as compared to a 1.9% for the CPI.
You can find it here:
https://www.bea.gov/iTable/iTable.cfm?reqid=12&step=1&acrdn=1#reqid=12&step=3&isuri=1&1204=2015&1203=2011&1206=m&1205=2017&1210=x&1211=0
This is table 7U for prices, tables 5U & 6U report the nominal and real numbers.
thanks for that, Spencer…i was going to make the same point about the often quoted “real retail sales” metric of the NBER and FRED, but didn’t have a link to the BEA deflator for retail to show how it should be done…
aside to Bert, online sales are included in this report; see the details here:
https://www.census.gov/retail/marts/www/marts_current.pdf
they’re up 10.2% year over year, about 12% of the total, but still smaller than other major components such as auto sales, grocery store sales, and restaurant sales..
You are welcome.
I have complained to Fred about their using the CPI.
But as you can see, it did not do any good.
Spencer:
I could talk to them too, if you like?
the “real retail sales” that FRED graphs originated with the NBER’s Business Cycle Dating Committee, Spencer; it’s one of the four economic indicators they use, in addition to GDP, to determine turning points in the economy for the purpose of making recession calls:
http://www.nber.org/cycles/general_statement.html
FRED took the indicators mentioned by the NBER and turned them into a “tracking the economy” page:
https://research.stlouisfed.org/economy/
about RRSFS, FRED says: “This series is constructed as Retail and Food Services Sales deflated using the Consumer Price Index for All Urban Consumers”
which as you point out, means they’re deflating sales of items purchased at retail with price increases for services such as rent, doctor’s visits, and college tuition..
if the NBER is using the same metric to determine economic turning points, then they may well get their recession calls wrong, too…