Arithmetic is Hard: Wage-Bracket Creep
There has been a lot of very good critique of the methodology of the University of Washington’s study of the minimum wage increase in Seattle. However, I want to repeat and emphasize a very simple point that jumps out.
A static low-wage cutoff point, whether it be $19 or $100, automatically reduces the size of the treatment group (Seattle) if wages in the treatment group are increasing faster than the wage of the control group.
This is not erudite statistical methodology. This is simple arithmetic. If the wages in the treatment group increase at a higher percentage rate than the wages in the control group, more workers are lifted above the $19 threshold in the treatment group than in the control group. This is true if the treatment group and the control group are otherwise absolutely identical. This is what I call wage-bracket creep. The extremely simplified example below shows how this looks, the yellow cells represent workers whose jobs and hours would be “lost” (to the study) as they pass the $19 threshold:
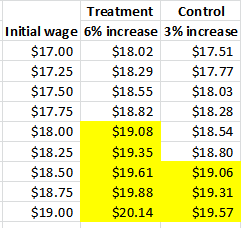
See how much worse off the treatment group is than the control group? The yellow cell occupants haven’t lost their jobs, they have simply been excluded from their respective groups because their wage now exceeds the static cutoff amount.
Of course, I wondered if the study authors could be making such a simple arithmetic mistake. So I reached out to one of the authors, who generously replied but appeared to confirm that they relied on a static threshold. I say appeared because some of the replies were, shall we say, “ambiguous” but did not disclaim use of a static threshold when I sought explicit confirmation or denial.
Only an economist would consider turning a lower paid worker into a higher paid worker a bad thing because it reduces the number of lower paid works and the aggregate wages of low paid work. This was my first thought when I read about that study. I assumed that I was somehow mistaken and that they used a more sophisticated analysis. The more I read, the more I realize that I was wrong. These people would hate a cancer vaccine because it would reduce the number of people being treated for cancer.
Kaleberg:
I know Sandwichman said some of the answers from the study participant were ambiguous and maybe this is because of all the attention the study is now getting. It is too obvious an error and such that I had to ask what was the error as I did not recognize it (looking for complexity). The ambiguity in answers could be the result of being too embarrassed by the simplicity of the error. It is a glaring error and it would have been caught. This is pretty simple stuff . . .
I would have been reluctant to believe my own interpretation of the “low-wage cutoff” assumption had I not tried, THREE TIMES to get an unambiguous answer to whether they did what I thought they said they did. My final (4th) email asked if they experimented with using deciles or a percentage of the overall average wage as the cutoff. It remains unanswered. Many years ago I was engaged in a labor union arbitration in which the consultant for the other side made a spreadsheet cut and paste error that accidentally added four years of seniority to every employee on one side of the merger. The error was blatant and could be checked against the original records from the employer. Nevertheless, the other side insisted there was no error for a long time and when they couldn’t do that any more insisted that the error “didn’t matter.” It is hard to admit an error when it is something that should be obvious and should have been caught by the researchers.
Congrats on making Financial Times!
Yep…congrats.
Thanks!
FT: The minimum wage wars are heating up
“A new study fails to prove its claim that Seattle wage floor hurts workers”
by Martin Sandbu
Free Lunch on FT Alphaville
Beauty in simplicity! If this is true, how do we control for it?
awww. it’s just an academic kerfuffle.
You state this:
“If the wages in the treatment group increase at a higher percentage rate than the wages in the control group, more workers are lifted above the $19 threshold in the treatment group than in the control group. This is true if the treatment group and the control group are otherwise absolutely identical.”
Why would the wages in the treatment and control group grow at different rates (apart from the <$19 threshold due to min wage)? Isn't the design of synthetic control such that there should not be any differential in growth of wages in control and treatment apart from simple the effect of the min wage? So the only way we would see something like your example of 6% treatment growth and 3% control growth would be if the synthetic control was not credible….
The researchers attribute a 3.1% wage increase to the minimum wage law. This indicates a difference in wage growth between the treatment and the control group. Whether or not the wage difference is actually due to the minimum wage is uncertain. Nevertheless, it is this 3.1% difference in wage growth that I was alluding to with my example using differential 6% and 3% growth rates. If you have another explanation for the 3.1% wage increase attributed to the minimum wage law by the researchers, I would be interested to hear about it.
Sorry, not sure if this is going to directly reply to your reply post…
I see, that example makes sense now. I do see what you are saying.
This 3.1% is the growth in wages under $19/hr… but you’d suspect that the this causal wage growth would be mostly due to changes in wages near the $11-14 or so mark. If they had split it up (for arguments sake) into <$14/hr and then $14-19/hr we would expect that growth estimate to be zero right? And if it is in theory zero (putting aside the criticism of how there are causal effects in the over $19/hr group), then we wouldn't expect any issues with bracket creep? (Or at least the same level of bracket creep as the control??)
Just trying to get my understanding right – this is a pretty big issue if it's real!!
Yes, the 3.1% wage growth, relative to the control, is for the under $19 workers. Wage growth for the entire single-site workforce as a whole was even larger — 8% — so I don’t suspect the wage growth was necessarily concentrated in the under $14 group but there is no way of knowing from the report. The report does document employment increase/decrease, relative to control, at each $1 “wage bin” but it doesn’t break down wage growth further than under $19 and overall.
Yes, I think it is a pretty big issue if it is real. It is not unusual for researchers to get so caught up in the arcane methodological techniques that they overlook a rather basic accounting or arithmetic error. Double counting, for example, is rife in seemingly sophisticated mathematical analyses. This is one reason I am cynical about the supposed “rigor” that math provides. It’s often a penny-wise, pound foolish rigor that can be detected by simply eyeballing the raw figures. My alarm went off when I looked at the astonishing overall wage growth and employment growth for the single site employers. If those numbers are real, that kind of growth would tend to distort everything else in the data set. If they are not real, the discrepancy indicates a noise problem with the data set that cannot be “corrected for” with fancy statistical techniques.
Call me old fashioned but I believe the role of arcane statistical analysis should be limited to making sure that the prima facie case is not an illusion. I have no confidence that researchers can milk hidden truths from data that are murky to the naked eye.