Why is inflation so low?… asks Menzie Chinn
Menzie Chinn over at Econbrowser posted on low inflation today. His argument is that there is still lots of slack from real GDP being way below potential real GDP and from high unemployment. The idea is that abundant slack depresses prices.
Inflation is generated as slack capacity is utilized. It’s the normal result of labor market forces in an expanding business cycle. Increased money from business expansion progressively chases fewer goods through marginally declining production.
Normally, slack production is balanced by weak liquidity in the hands of consumers. But there is a deeper problem here than Menzie points to. He is pointing to a present situation of slack capacity, but the problem of slack capacity is so much broader and deeper, because liquidity in the hands of consumers is at a much lower level permanently now. So even if you have spare capacity and slack in the economy, inflation would still trend low.
I will explain using this log graph of inflation, unit labor costs and labor share. (1970 to present) The graph is based on the equation…
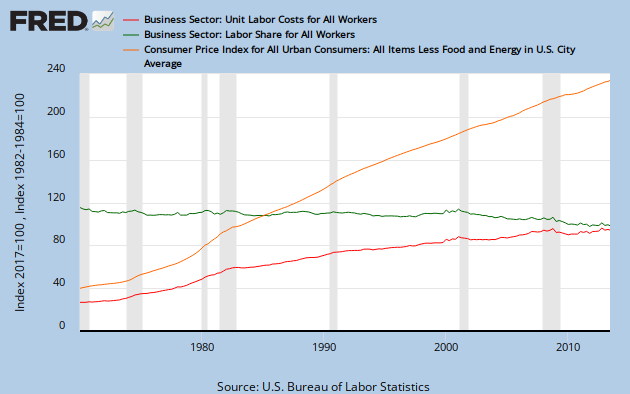
Inflation = unit labor costs/labor share

Graph #1 (view by clicking on post title above.)
The orange line above reflects the growth rate of inflation in log terms since 1970. We see a long-trend of inflation slowing down. Thus we can conclude that low inflation could not solely be due to the apparent slack in the economy now. There is a lower inflation long-term trend to account for.
So why low inflation? Inflation basically depends upon
- enough money in the economy to support it
- enough wages or credit consumption in the hands of labor to support it
- expectations of inflation and
- purchasing behavior.
As for #1, we see that lending is not getting enough money into the economy and into the hands of labor, the consumers. As for #2, we see that low wages and de-leveraging do not support higher prices. As for #3, the driving force behind consumption is labor, and labor does not have expectations of higher wages. They have expectations of stagnant wages. Then as for #4, prices are a reflection of the consumer’s fear to not spend more on items than they are accustomed to within their budget.
Labor share has fallen 5% since the crisis. Total labor hours are still the same as 15 years ago. The consumer has a long-term weakening of purchasing power on balance.
Here is a conceptual equation for inflation.
Inflation = (unit labor cost – labor share)/(utilization of labor and capital).
According to this equation, increased utilization of labor and capital will tend to lower inflation. As you increase supply using more factors of production, prices decline, all else being equal. We now have a situation where real GDP growth is dependent upon increased labor hours and capital utilization because productivity has been flat for 3 years. So the equation above explains part of the low inflation, but recently inflation is tracking downward more than the equation would predict. Something is happening between unit labor costs and labor share.
Normally unit labor costs rise in relation to a fairly stable labor share. It’s the normal process of labor market forces in a vibrant expanding economy. Inflation is supported by those forces. Over the years though, unit labor costs have been growing more slowly. There was an abrupt slowdown during the Volcker recession.
But now, we see an important shift in the graph above. Now unit labor costs are stable (flat-lining) while labor share is declining. The two have reversed their roles. This dynamic can still show inflation but it shows weak inflationary pressure.
Notice above that this same dynamic happened after the 2001 recession. Real wages stagnated. And the recovery was very slow, especially for labor.
Inflation needs unit labor costs to build upon a stable foundation of labor share. But when the labor share foundation is giving way, unit labor costs trend into a low inflation expectation. Inflation loses its support to respond to market forces. A declining labor share foundation has not only weakened demand, it has also weakened the foundation of inflation.
The long-run suppression of wages and labor hours is reflected in lower unit labor costs, weakening the purchasing power of labor and this then feeds back to drag inflation down. Lower wage power and lower inflation is a self-reinforcing dynamic over time. Easy credit hid this dynamic before the crisis, but not now.
I expect inflation to start picking up by the end of the year. Labor share is stabilizing now, which is creating that foundation for inflation. Unit labor costs will respond to this. You see unit labor costs started moving upward around 2004 in the graph above. Inflation began to build from that point forward to the crisis. I see a similar dynamic this time.
I also see that the economy will be closing in on the LRAS curve with the year. This will translate into inflation potential. I will finish with a graph of inflation plotted against the utilization of labor and capital with data from before the last crisis until 1Q-13. (Blue line is before the crisis. Orange line is since the crisis.) (Inflation is… Consumer price index for all Urban consumers: all items less food and energy, quarterly data.)

Graph #2 (view by clicking on post title above.)
Empirical data spot on however I believe a much simpler conclusion. Fed isn’t printing money. In fact it is massively draining real income from a stable workforce. Complete control except it don’t matter until deflation becomes uncontrollable. A train is coming from behind you and the establishment wants it to hit!!! Stable 2.7% income no HYPER-inflation is my forecast. TV RATES TRUE REAL INTEREST RATES ARE FALSE or at least I believe my house is going up. Central bank now is the TREASURY and it increased its back end by 10x nice. Lies never come true