Note to Reinhart/Rogoff (et. al): The Cause Usually Precedes the Effect
Or: Thinking About Periods and Lags
No need to rehash this cock-up, except to point to the utterly definitive takedown by Arindrajit Dube over at Next New Deal (hat tip: Krugman), and to point out that the takedown might just take even if you’re looking at R&R’s original, skewed data.
But a larger point: I frequently see econometrics like R&R’s, comparing Year t to Year t and suggesting — usually only implicitly or with ever so many caveats and disqualifiers — that it demonstrates some kind of causation. I.e. GDP growth in 1989 vs. debt in 1989, ’90 vs. ’90, etc.
Haven’t they heard of looking at lags, and at multiple lags and periods? It’s the most elementary and obvious method (though obviously not definitive or dispositive) for trying to tease out causation. Because cause really does almost always precede effect. Time doesn’t run backwards. (Unless you believe, like many economists, that people, populations: 1. form both confident and accurate expectations about future macro variables, 2. fully understand the present implications of those expectations, and 3. act “rationally” — as a Platonic economist would — based on that understanding.)
By this standard of propter hoc analysis, R&R’s paper shows less analytical rigor than many posts by amateur internet econocranks. (Oui, comme moi.) This is a paper by top Harvard economists, and they didn’t use the most elementary analytical techniques used by real growth econometricians, and even by rank amateurs who are doing their first tentative stabs at understanding the data out there.
Here’s one example looking at multiple periods and multiple lags, comparing European growth to U.S. growth (click for larger).
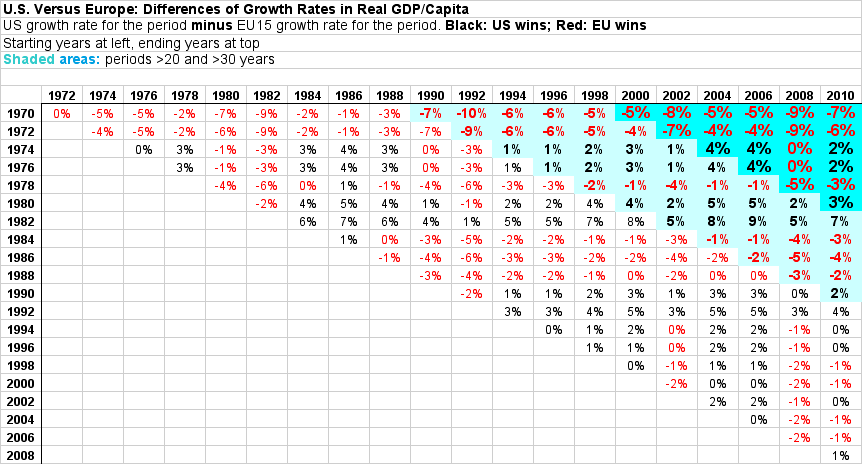
This doesn’t show the correlations between growth and various imagined causes for the periods (tax levels, debt levels, etc.) — just the difference, EU vs. US, in real annualized growth. You have to do the correlations in your head, knowing, for instance, that the U.S. over this period taxed about 28% of GDP, while European countries taxed 30–50%, averaging about 40%.
But it does show the way to analyzing those correlations (and possible causalities), by looking at multiple periods and multiple lags. (I’d love to see multiple tables like this populated with correlation coefficients for different “causes.”)
Dube tackles the lag issue for the R&R sample beautifully in his analysis. In particular, he looks at both positive and negative lags. So, where do we see more correlation:
A. between last year’s growth and this year’s debt, or
B. between last year’s debt and this year’s growth?
The answer is B:
Figure 2: Future and Past Growth Rates and Current Debt-to-GDP Ratio

(Also: if there’s any breakpoint for the growth effects of government debt, as suggested by R&R, it’s way below 90% of GDP. More like 30%.) See Dube’s addendum for a different version of these graphs, using another method to incorporate multiple lags.
Here’s what I’d really like to see: analysis like Dube’s using as its inputs many tables like the one above, each populated with correlations for a different presumed cause (“instrumental variable”). Combine that with Xavier Sala-i-Martin’s technique in his paper, “I just ran four million regressions“.
That paper looks at fifty-nine different possible causes of growth/instrumental variables (not including government debt/GDP ratio) in every possible combination, to figure out which ones might deliver robust correlations. I’m suggesting combining that with multiple periods and lags for each instrumental variable. IOW, “I just ran 4.2 billion regressions.” Not sure if we’ve got the horsepower yet, but…
Cross-posted at Asymptosis.
Yeah (slap to R & R’s forehead) cause comes before effect, and not the other way around. For “scientists” they are very immature in their scientific development or should I say they are of very young age scientifically.
“As is evident, current period debt-to-GDP is a pretty poor predictor of future GDP growth at debt-to-GDP ratios of 30 or greater—the range where one might expect to find a tipping point dynamic. But it does a great job predicting past growth.
This pattern is a telltale sign of reverse causality. Why would this happen? Why would a fall in growth increase the debt-to-GDP ratio? One reason is just algebraic. The ratio has a numerator (debt) and denominator (GDP): any fall in GDP will mechanically boost the ratio. Even if GDP growth doesn’t become negative, continuous growth in debt coupled with a GDP growth slowdown will also lead to a rise in the debt-to-GDP ratio.
Besides, there is also a less mechanical story. A recession leads to increased spending through automatic stabilizers such as unemployment insurance. And governments usually finance these using greater borrowing, as undergraduate macro-economics textbooks tell us governments should do. This is what happened in the U.S. during the past recession. For all of these reasons, we should expect reverse causality to be a problem here, and these bivariate plots are consistent with such a story.”
Which is basically a re-hash of what the Paul Ryan led deficit-hawks fail to understand. Of course, they bought into the R&R research, so taking into consideration the economic environment is irrelevant, so therefore debts are bad whenever/however they accumulate.
It’s called data mining, where the conclusion is pre-ordained and the “researcher” sorts and discards data until the R2 of the sum of the squares of the (predicted – observed is at a minimum) / sum( can’t recall) is minimized.
One can smooth the data with lags or logarithms or whatever. Or rejecting data that doesn’t fit. Pretty standard technique. Ask Dr. Krugman about this with his seminal paper on “fwee twade” .
The “fwee twade” was such a small number that he deduced that it was not the economic agent of destruction that the Walmartians knew it was.
Reinhart and Rogoff are no more quacks as Dr. Krugman and De Long are.
They just drank the kool-aid and set about making it so. That’s all well and good except they established the status quo.
That’s the problem.
@Mr. Bill:
“It’s called data mining, where the conclusion is pre-ordained”
While there might be some of that going on, I would suggest, rather, that R&R is just sh***y, fourth-rate analysis. Really amateur-blogger level except:
They spent a *lot* of effort compiling the raw data. That’s incredibly valuable (now that it’s been shared, and cleaned up/fixed). I can’t imagine most amateurs like me do that yeoman’s work.
” I would suggest, rather, that R&R is just sh***y, fourth-rate analysis.”
Yeah and it was done with a National Science Institute grant. Where’s all those conservative that should be yapping about government waste, and government picking winners and losers? Aren’t they always complaining about government spending on science?
well
i think the economics profession should be hanging its head in shame for not having caught this the week it was published.
and our “leaders” should be fired for incompetence for not catching it themselves. during the whole social security “debate” i have seen NO evidence that ANYone checks “the math.” but they love to say “it’s just math.”
please note, there is a difference between “math” and “arithmetic.”
Recent
History—————————A revealing interview by Charlie Rose (PBS) some years ago with Milton Friedman, the main advocate of our current [? -partially]] economic philosophy, illuminates a long term strategy.
Charlie Rose asked Friedman if he, as a conservative, was not very concerned that Reagan’s tax cuts led to enormous deficits.
Charlie Rose was taken aback when Friedman replied: ‘Oh no, not at all – the bigger the debt the better, because only if the the debt burden becomes unbearable will people agree to get rid of the New Deal programs’ (such as Unemployment programs, Social Security, etc).
That is exactly the situation today: the accumulated debt has become so unbearable that everybody is alarmed and many people are now ready to junk just about the entire social safety net.
http://www.hyperhistory.com/online_n2/connections_n2/friedman.html
I seem to recall ‘methodological’ issues with his ”The Monetary History of the United States” though such ideas may only have been from beet juice crazed Keynesian walrus.